class: center, middle, inverse, title-slide .title[ # Integrative Genomics Viewer ] .author[ ### Rockefeller University, Bioinformatics Resource Centre ] .date[ ### <a href="https://rockefelleruniversity.github.io/IGV_course/" class="uri">https://rockefelleruniversity.github.io/IGV_course/</a> ] --- ## IGV Overview .pull-left[ - Introduction to IGV. - What is IGV. - How to run IGV Desktop. - Navigating IGV. - The IGV user interface. - Moving around genomes. - Loading and visualizing data. - Genome information and annotation. - User supplied data. - Sample information. - External data. - Displaying genomics data - Basic visualization. - Data dependent visualization. ] .pull-right[ - IGV web - How to run IGV web - Navigating IGV web - Loading and visualizing data - Sharing web sessions ] --- ## What is IGV? - Created by the Broad institute. - Desktop Genome browser. - Visualizes genomic data (expression, ChIP, resequencing, multiple alignment, shRNA). - Handles most common genomic data types. - Local java application - No dependence on server. - Loads data locally or from URL, consumes local memory and CPU. --- ## How to get IGV? - Desktop, Web app and Juicebox - Desktop - Runs locally on desktop using Java - Web app - Runs locally in web browser using JavaScript - Juicebox - For Hi-C like data, runs locally on desktop using Java <div align="center"> <img src="imgs/broad2.png" alt="igv" height="400" width="400"> </div> http://www.broadinstitute.org/software/igv/download --- ## How to run IGV Desktop? .pull-left[ - Download to computer (recommend those including Java). - Runs locally out of the box. - Archived versions available. - In case you liked functionality of previous version better. - Snapshots of development versions available. - These may be unstable and/or have features which are not included in release version. ] .pull-right[ <div align="center"> <img src="imgs/binary2.png" alt="igv" height="400" width="300"> </div> ] --- ## IGV GUI 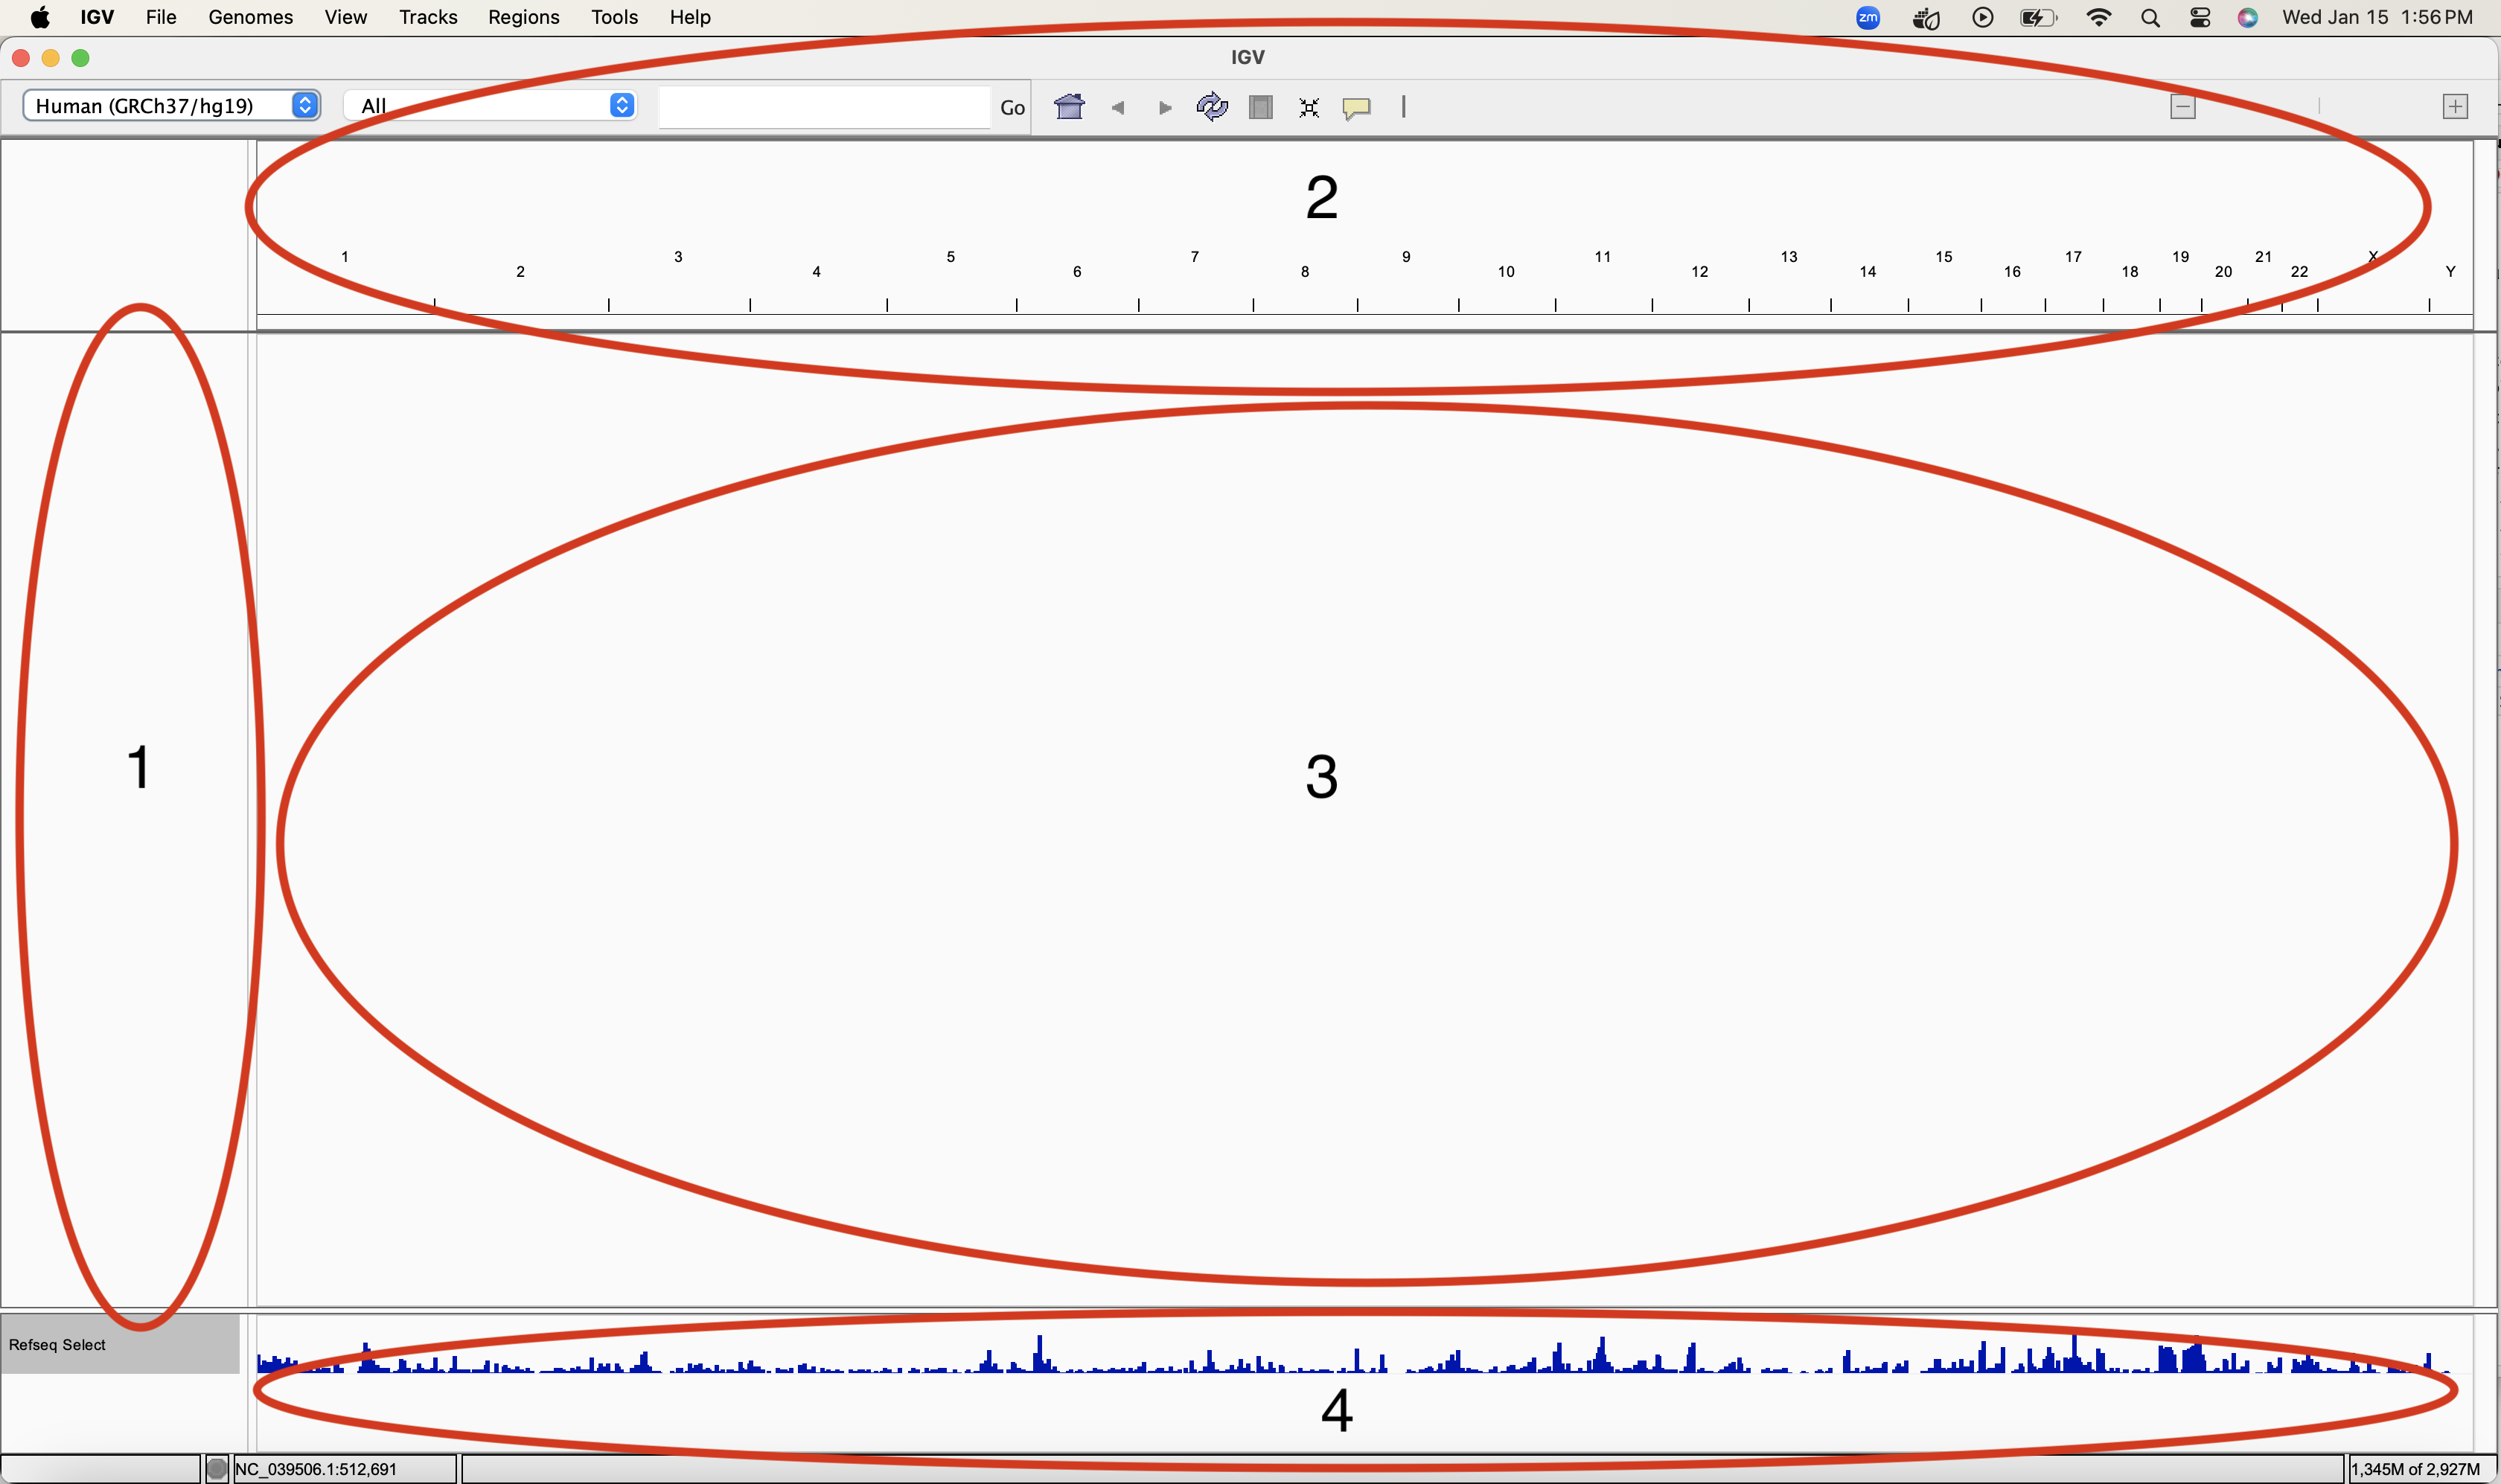 --- ## IGV GUI .pull-left[  ] .pull-right[ - Sample information panel <1> - Genome Navigation panel <2> - Data panel <3> - Attribute panel <4> ] --- ## Menu bar 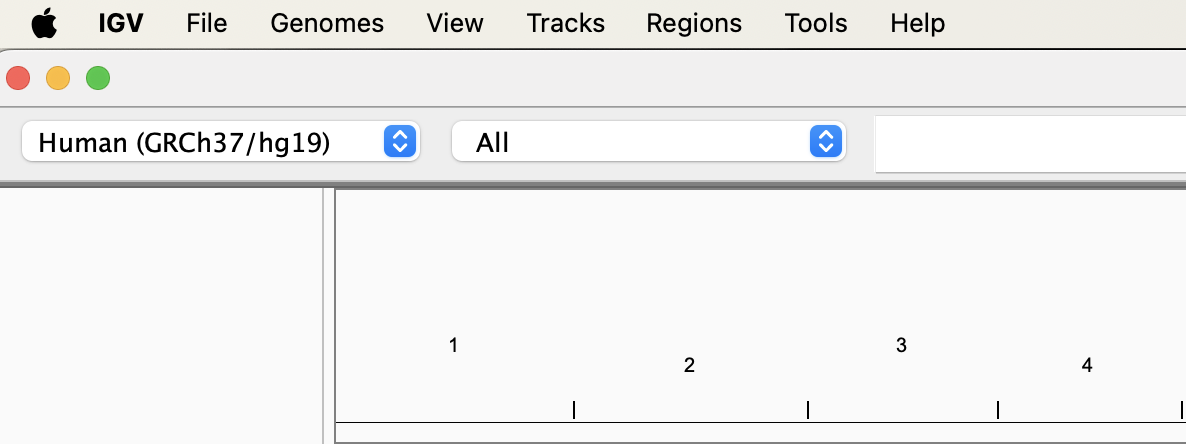 - File - Load data/sample information. - Genomes - Load and manage genomes. - View - Display preferences. - Tracks - Group/sort/filter data tracks. - Regions - Create region/gene lists. - Tools - Access to Integrated tools (IGVtools/Bedtools). --- ## Moving around genomes - Cytoband selection and zooming - Scrolling - Selection of region of interest <div align="center"> <img src="imgs/moving.png" alt="igv"> </div> --- ## Moving around genomes 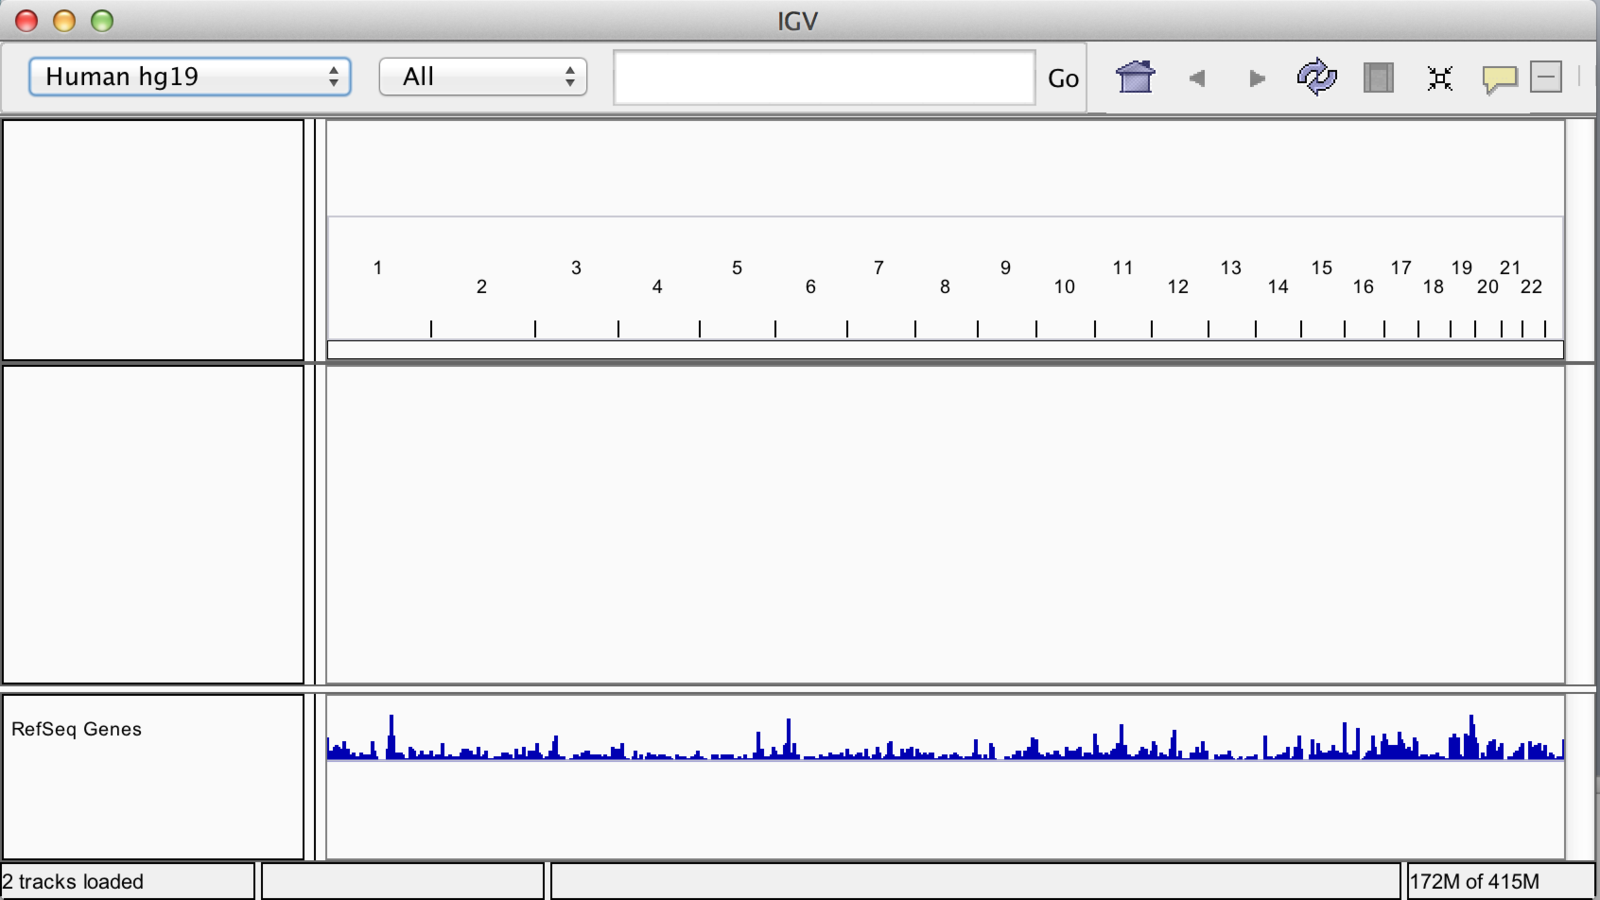 --- ## Zoom .pull-left[ 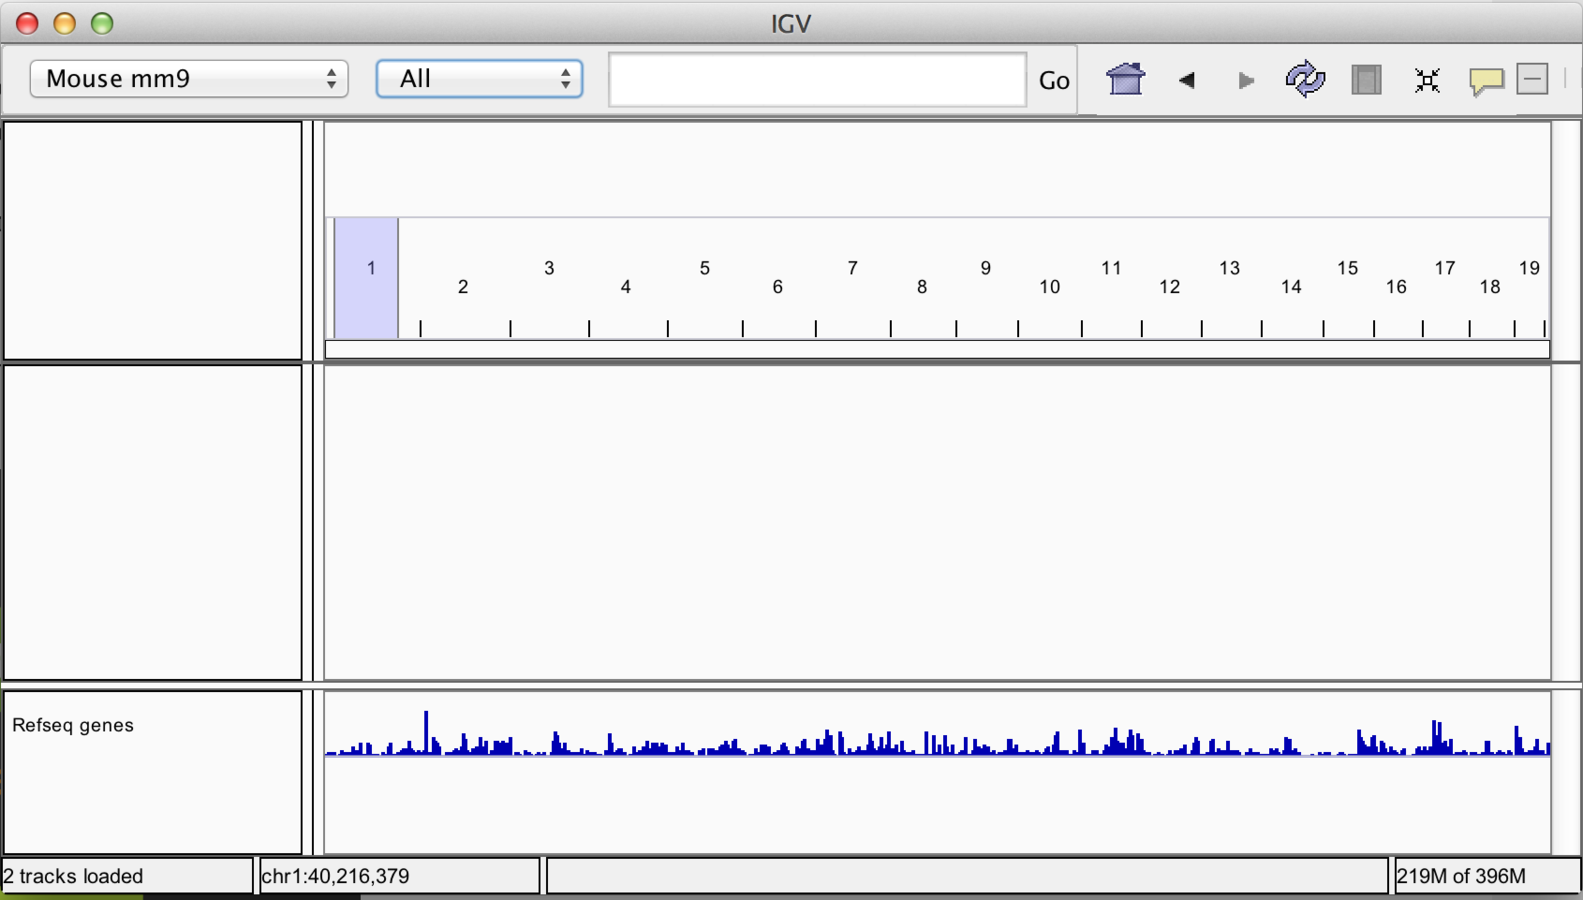 ] .pull-right[  ] --- ## Scrolling  --- ## Jump to region .pull-left[  ] .pull-right[  ] --- ## “Bookmarking” regions of interest - Regions may be added to “Regions of interest”. - These act as bookmarks for areas of particular interest. - Bookmarks can be added by: - Bookmarking visible window. - Selecting region within window. --- ## Bookmarking - Visible window .pull-left[ 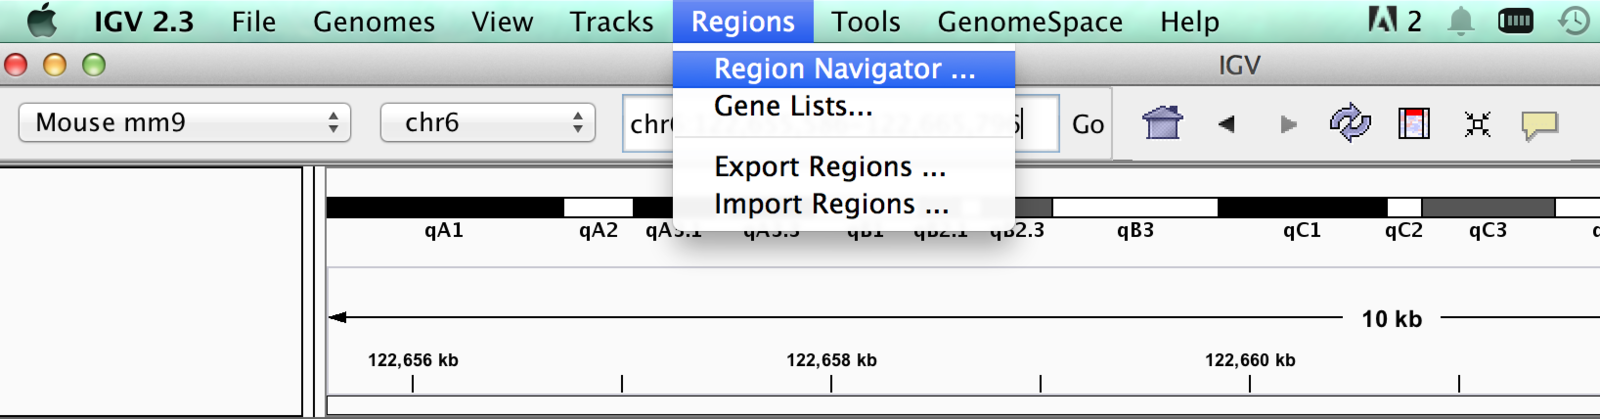 ] .pull-right[ 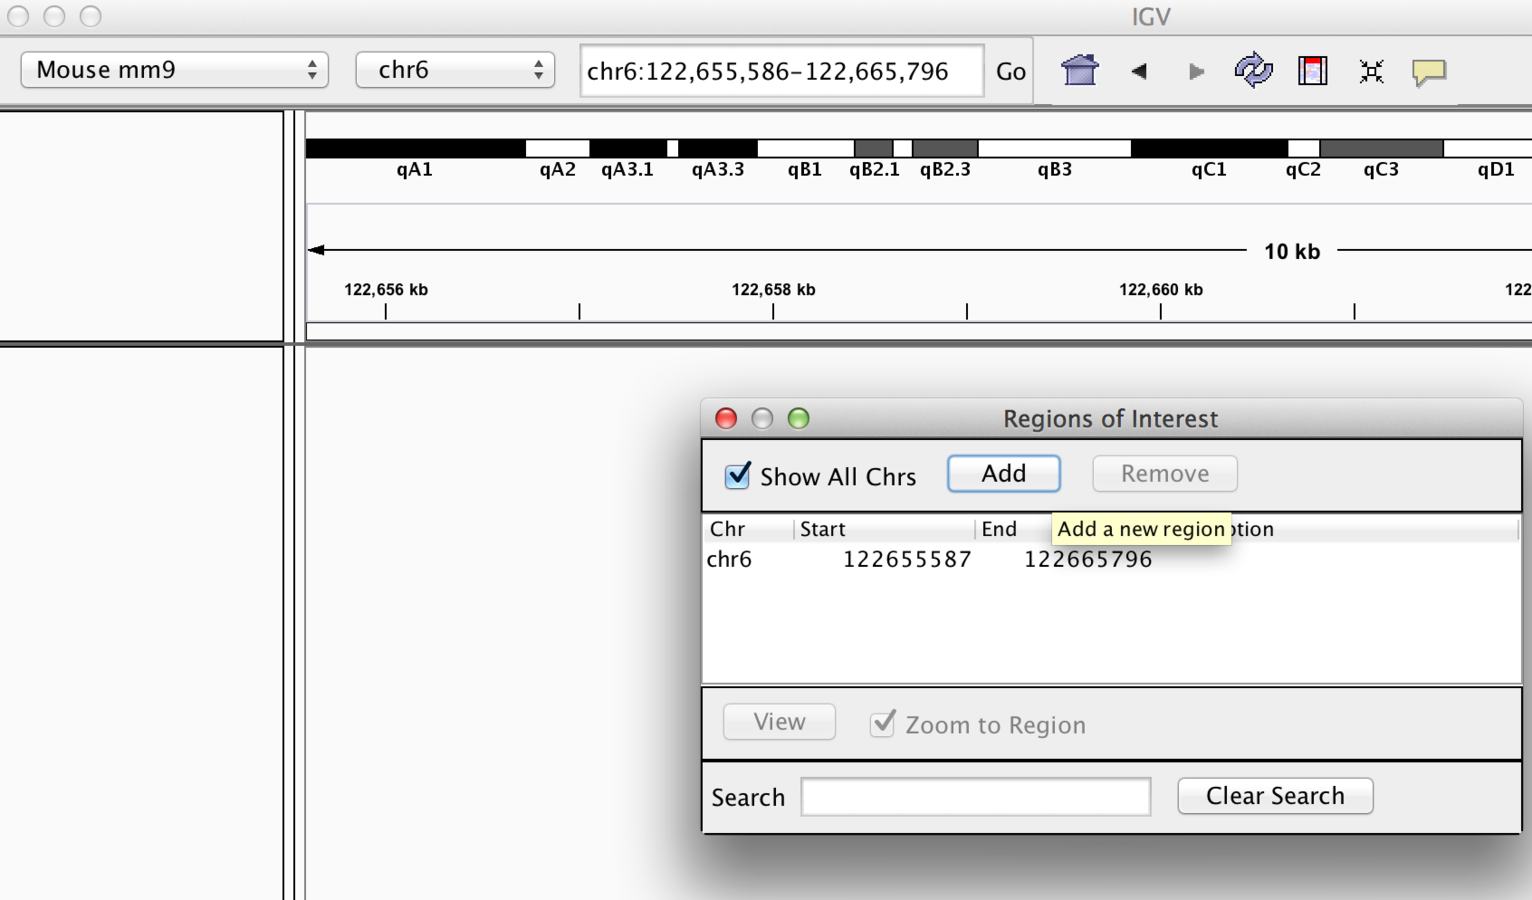 ] --- ## Bookmarking <div align="center"> <img src="imgs/book3.png" alt="igv" height="400" width="600"> </div> --- ## Bookmarking - Bookmarks may be created quickly by selecting "region of interest" button. - Once selected just point-and-click where you want each edge to be. <div align="center"> <img src="imgs/book4.png" alt="igv" height="400" width="600"> </div> --- ## Sequences from regions of interest - A useful feature of "regions of interest" is to retrieve the sequence. - You can even directly BLAT sequences. <div align="center"> <img src="imgs/seq1.png" alt="igv" height="400" width="600"> </div> --- ## Sequences from regions of interest - BLAT results present as table of hits. <div align="center"> <img src="imgs/seq2.png" alt="igv" height="400" width="600"> </div> --- ## Viewing sequences - At a predefined resolution, sequence information becomes available. <div align="center"> <img src="imgs/seq3.png" alt="igv" height="400" width="600"> </div> --- ## Viewing sequences - Strand of sequence can be altered. - Differing translation tables can be selected. <div align="center"> <img src="imgs/seq4.png" alt="igv" height="400" width="600"> </div> --- ## Gene Lists - When you do not have a region of interest but a group of genes you can use Gene Lists ("Regions" > "Gene Lists"). - You create your own list or use one of the curated lists. <div align="center"> <img src="imgs/GL1.png" alt="igv" height="400" width="600"> </div> --- ## Gene Lists Using gene lists you can visualize several genes concurrently. <div align="center"> <img src="imgs/GL2.png" alt="igv" height="400" width="600"> </div> --- class: inverse, center, middle # Loading data in IGV <html><div style='float:left'></div><hr color='#EB811B' size=1px width=720px></html> --- ## Loading Genome Information - Many genomes can be selected from dropdown. .pull-left[ 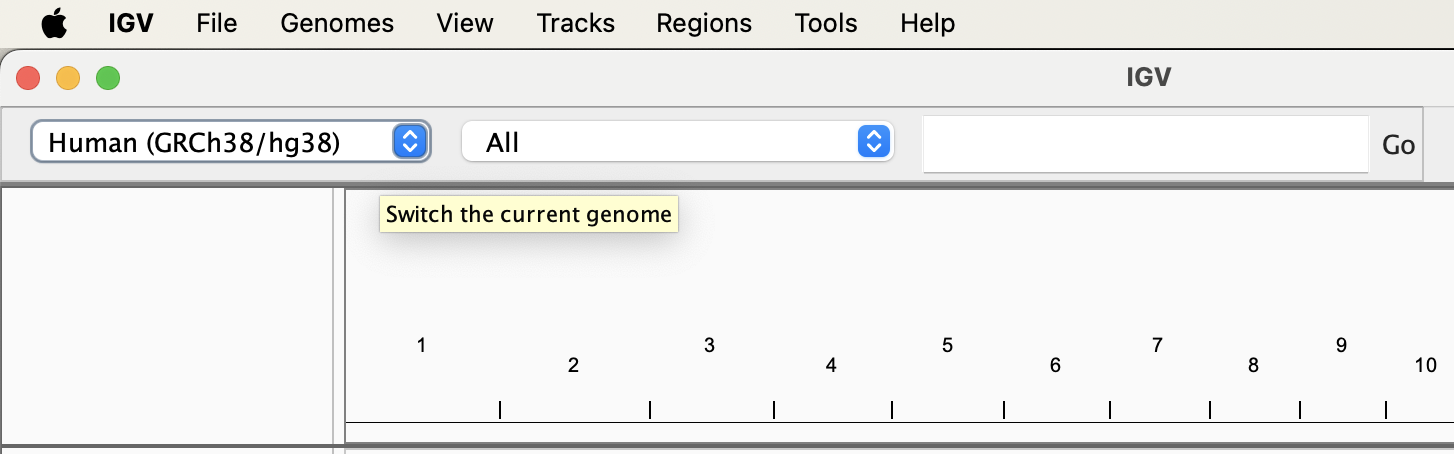 ] .pull-right[ 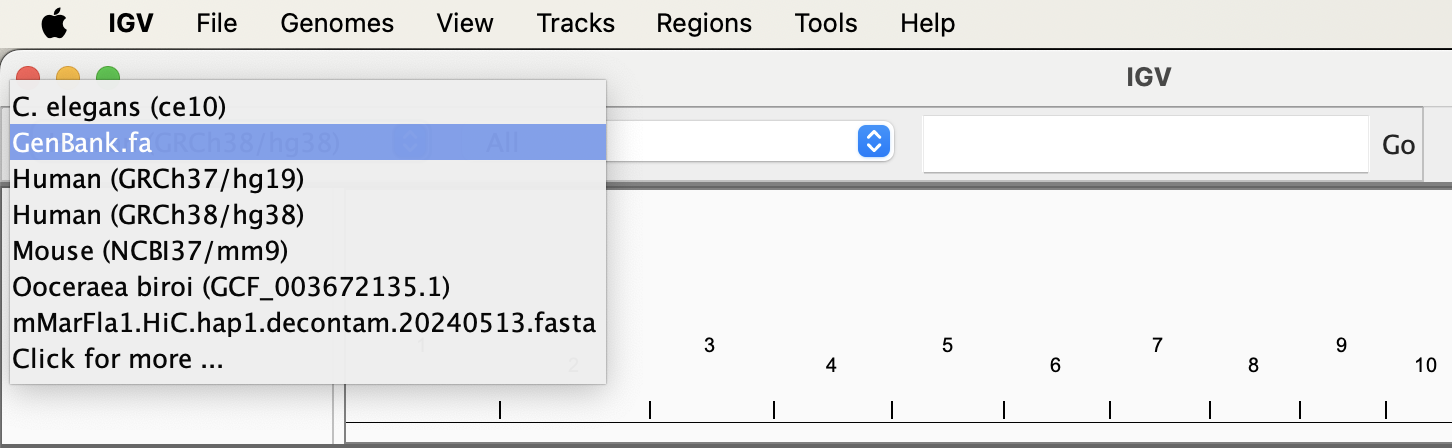 ] --- ## Loading Genome Information .pull-left[ - Genomes not included may be downloaded from repository - Users can select whether to download sequence/annotation or use version hosted online for many genomes. ] .pull-right[  ] --- ## Loading Genome Information - For supported genomes, gene positions are automatically included in “feature” panel. - Additional gene positions can be loaded into IGV in gff format <div align="center"> <img src="imgs/moving.png" alt="igv" height="400" width="800"> </div> --- ## Loading custom genomes IGV allows users to load their own custom genomes. .pull-left[ Custom genomes can be loaded from - **FASTA** - Chromosome sizes file (fai) - [JSON file](https://igv.org/doc/desktop/#FileFormats/Genomes/#igv-reference-genome-json) for genome+annotation ] .pull-right[  ] --- ## Loading genomes from GenomeArk Genomes can also loaded directly from [UCSC Genome Archive](https://hgdownload.soe.ucsc.edu/hubs/) .pull-left[  ] .pull-right[  ] --- ## Loading Sample data - Most common formats can be loaded into IGV through file menu - Acceptable data formats include:- - BED (.bed) - BAM and index (.bam with .bai/.bam.bai) - BigWig (.bw) - BedGraph/Wig (.bedGraph, .wig) - And many more... - For a full list of compatible file formats check out the [IGV website](https://software.broadinstitute.org/software/igv/FileFormats) --- ## Loading Sample Metadata .pull-left[ - IGV allows the inclusion of information on samples. - Sample information is included in sample information panel. ] .pull-right[  ] --- ## Loading Sample Metadata Example Sample information file http://www.broadinstitute.org/igvdata/exampleFiles/exampleSampleInfo.txt <div align="center"> <img src="imgs/smdT.png" alt="igv" height="400" width="800"> </div> --- ## Sample Metadata with TrackTables - [Tracktables](https://bioconductor.org/packages/release/bioc/html/tracktables.html) is a R/Bioconductor package. - Creates HTML reports with sample information for use with IGV. <div align="center"> <img src="imgs/tracktables.png" alt="igv" height="400" width="500"> </div> --- ## Creating SampleMetadata in excel The most straightforward way to build is most often to use excel/openoffice. - Create an ID column containing names of files you want to load. - Add additional columns of metadata - Export file as a tab separated file for loading into IGV. <div align="center"> <img src="imgs/excelsamplemeta.png" alt="igv" height="400" width="500"> </div> --- ## Using sample information - Sample information can include discrete and continuous. - Can be used to “sort” and “filter” tracks. - Can split tracks across panels by “group” --- ## Using sample Information .pull-left[ <div align="center"> <img src="imgs/tt1.png" alt="igv" height="150" width="500"> </div> ] .pull-right[ <div align="center"> <img src="imgs/tt2.png" alt="igv" height="400" width="500"> </div> ] --- ## Loading external data and annotation ** Load data from a URL ** - As with UCSC, IGV supports data hosted on external servers. - Data accessible from a URL such as HTTP and FTP can be loaded using "File" > “Load from URL”. --- ## Load data from a URL Try: "https://www.encodeproject.org/files/ENCFF697TWO/@@download/ENCFF697TWO.bigWig"  --- ## Loading external data and annotation ** Load data from a server (IGV/Encode servers)** - Unlike UCSC, IGV comes with few external tracks. - External tracks (relevant to the genome) can be loaded from the IGV server or Encode-IGV server. --- ## Load data from a server (IGV) .pull-left[  ] .pull-right[  ] --- ## Load data from a server (Encode) .pull-left[  ] .pull-right[ 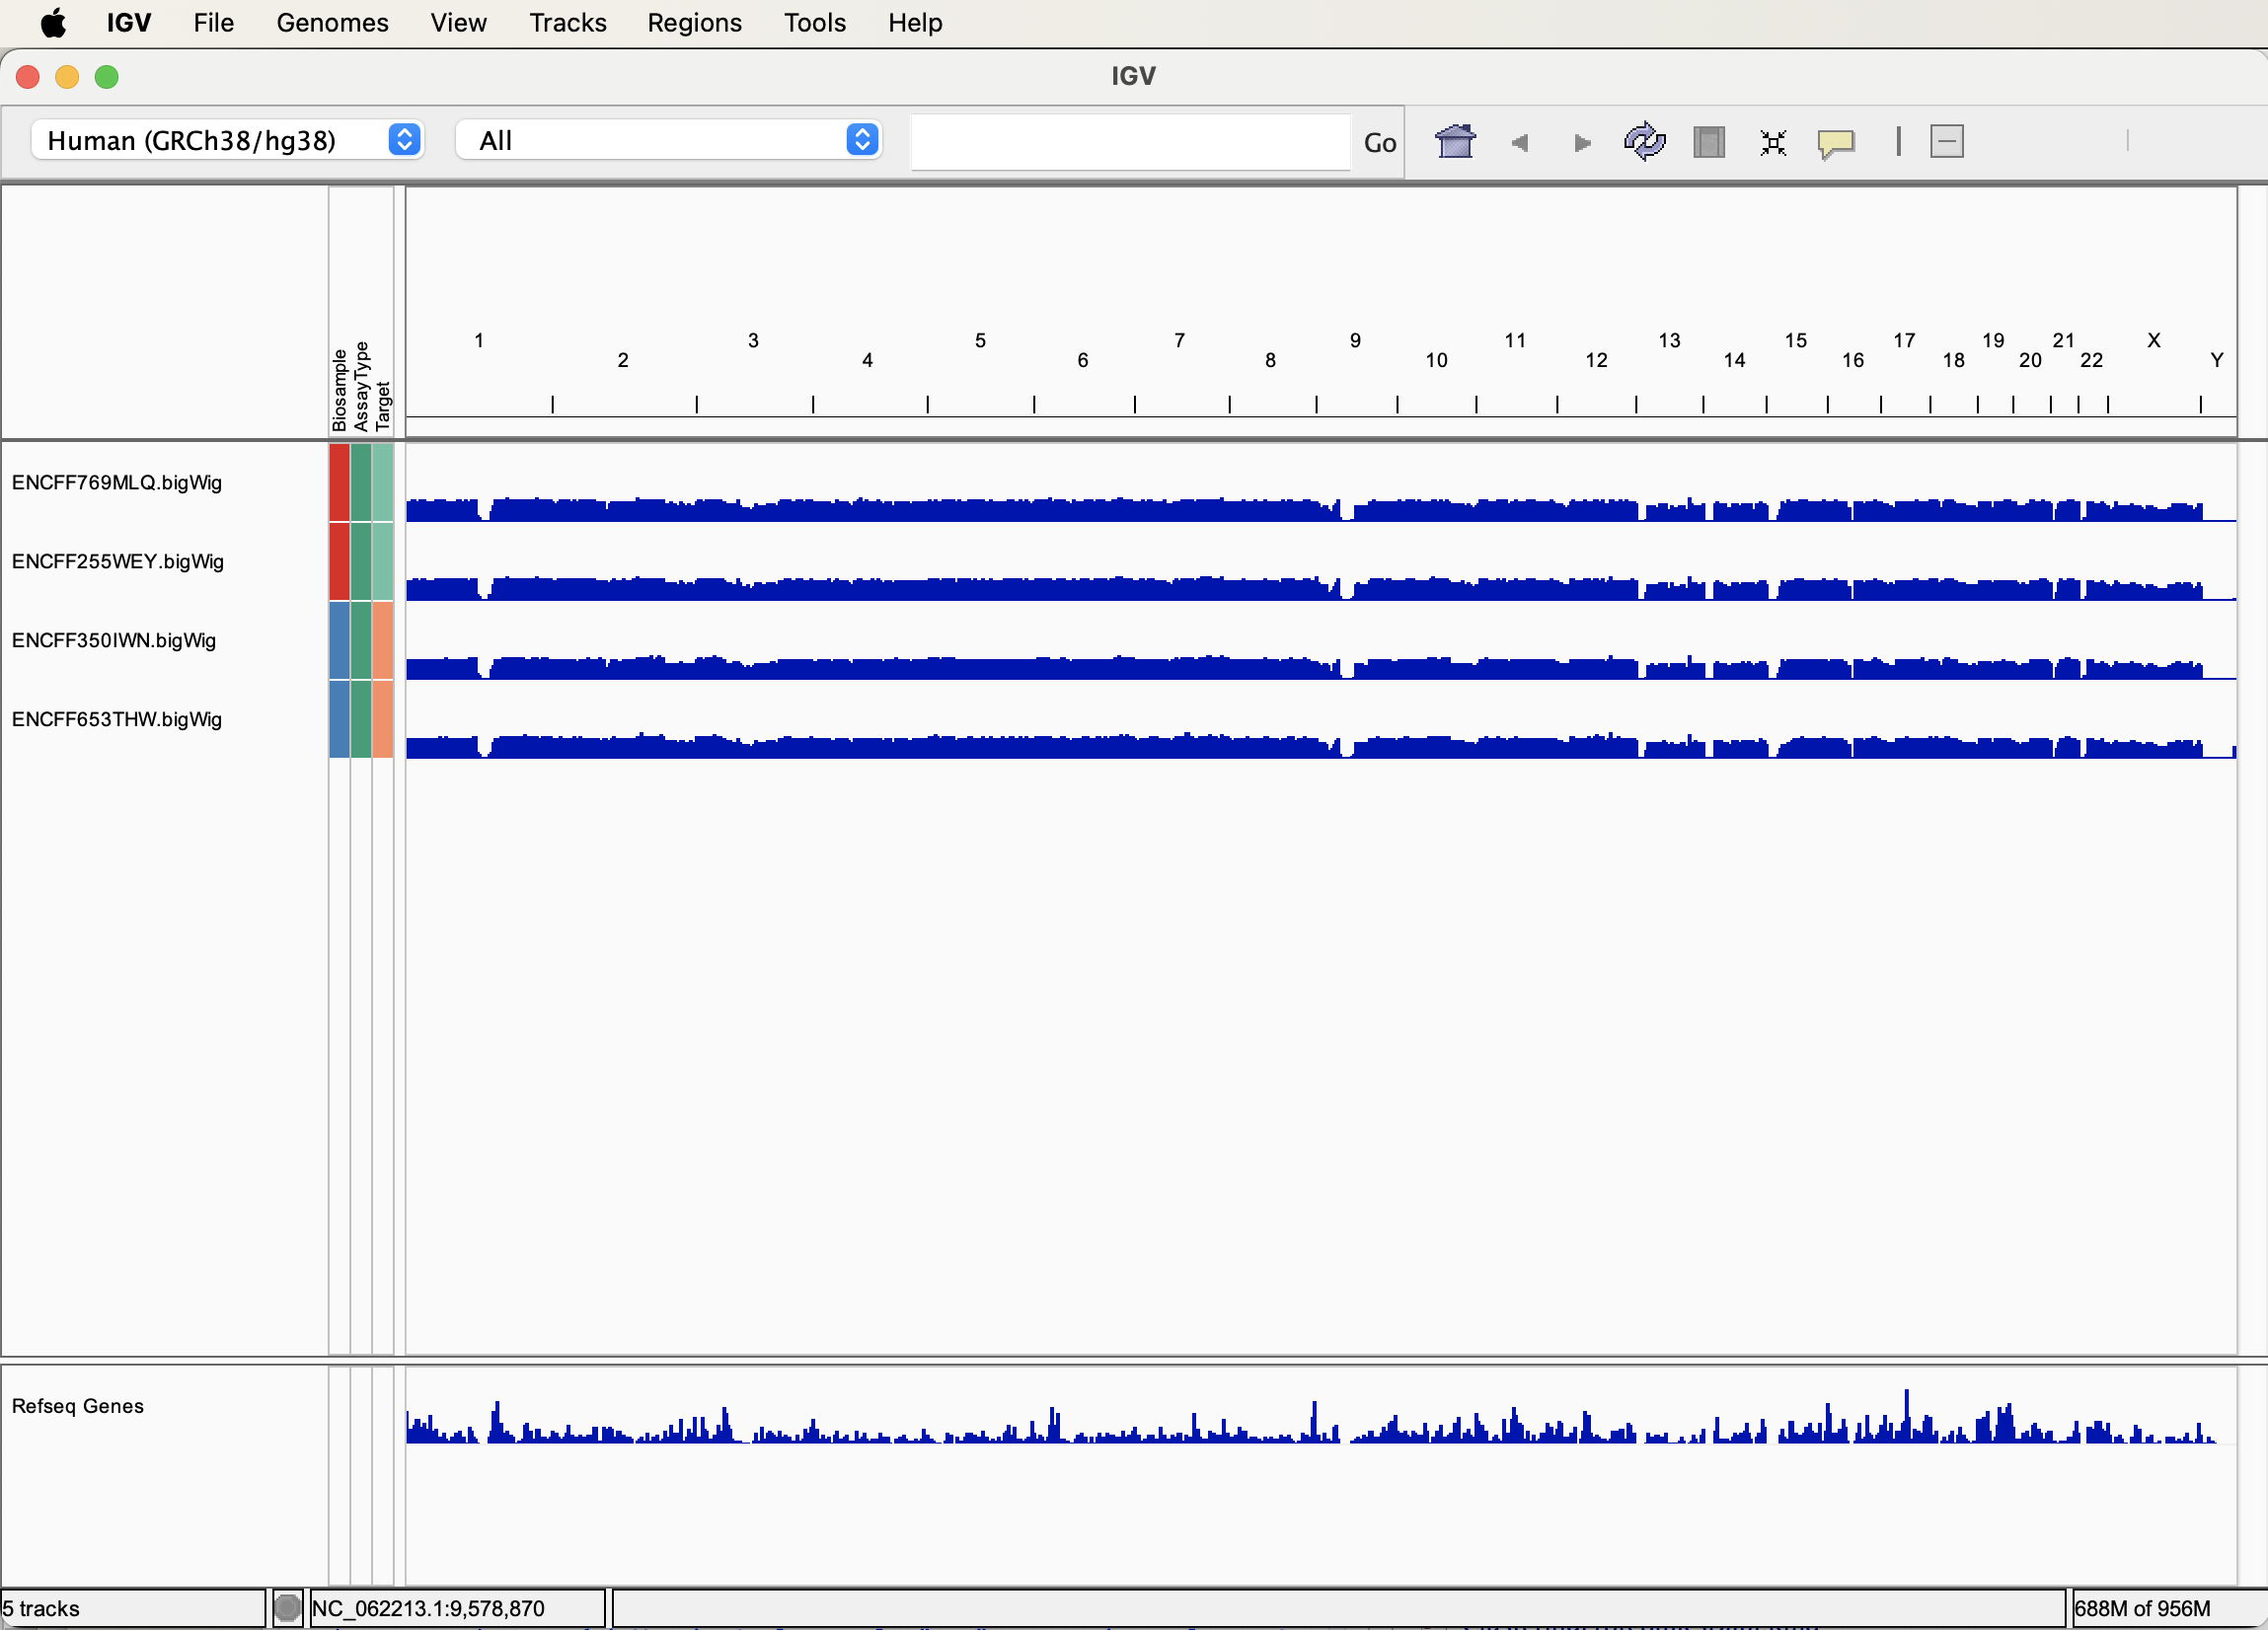 ] --- ## Grabbing encode data directly - Encode data can be downloaded from UCSC. - http://genome.ucsc.edu/ENCODE/ - This however does not come with sample information provided through IGV interface. --- class: inverse, center, middle # Viewing Data <html><div style='float:left'></div><hr color='#EB811B' size=1px width=720px></html> --- ## Viewing data - IGV associates common file formats with default display methods. - Most of the time IGV will make a sensible choice how we wish to display data. --- ## Accepted formats and default display. - Information on accepted file formats and default display can be found at: http://www.broadinstitute.org/software/igv/RecommendedFileFormats <img src="imgs/af.png" alt="igv" height="400" width="700"> --- ## Bed/bigBed .pull-left[ - Basic - Tab-delimited - Chrom,Start,End - Bed6 - bigBed (recommended) ] .pull-right[ <img src="imgs/bbed.png" alt="igv" height="400" width="700"> ] --- ## Wig, BedGraph and BigWig .pull-left[ - Wig/bedGraph require high memory load. - Recommended format is bigWig. ] .pull-right[ <img src="imgs/wigBg.png" alt="igv" height="400" width="700"> ] --- ## BAM alignment files .pull-left[ - BAM files contain alignment information. - Require an accompanying .bai index file for display. ] .pull-right[ <img src="imgs/bam1.png" alt="igv" height="400" width="700"> ] --- ## Finer control of display - IGV allows for customization of track display. - "View" > "Preferences" - Select track (right click) --- ## Display preferences ** General ** <div align="center"> <img src="imgs/general_2.png" alt="igv" height="400" width="400"> </div> --- ## Display preferences ** Tracks ** <div align="center"> <img src="imgs/tracks_2.png" alt="igv" height="400" width="400"> </div> --- ## Display preferences ** Alignments ** <div align="center"> <img src="imgs/alignments_2.png" alt="igv" height="400" width="400"> </div> --- ## Track display options ** Graph/interval files** - Track colour/appearance <div align="center"> <img src="imgs/tdg.png" alt="igv" height="400" width="400"> </div> --- ## Track display options ** Graph/interval files** - Graph type <div align="center"> <img src="imgs/tdg2.png" alt="igv" height="400" width="400"> </div> --- ## Track display options **Data Scaling** <div align="center"> <img src="imgs/tds.png" alt="igv" height="400" width="400"> </div> --- ## Track display options Autoscaling adjusts to track's visible signal maximum. <div align="center"> <img src="imgs/scaling.png" alt="igv" height="400" width="400"> </div> --- class: inverse, center, middle # Some more useful IGV features <html><div style='float:left'></div><hr color='#EB811B' size=1px width=720px></html> --- ## IGV displays splicing <div align="center"> <img src="imgs/splicing.png" alt="igv" height="400" width="400"> </div> --- ## IGV's Sashimi plots (https://software.broadinstitute.org/software/igv/Sashimi) <div align="center"> <img src="imgs/shashimi.png" alt="igv" height="400" width="400"> </div> --- ## IGV - Overlay tracks <div align="center"> <img src="imgs/overlay.png" alt="igv" height="400" width="400"> </div> --- ## Overlay tracks <div align="center"> <img src="imgs/overlay2.png" alt="igv" height="400" width="400"> </div> --- ## Track summarisation IGV can be used to combine tracks <div align="center"> <img src="imgs/combineDT.png" alt="igv" height="400" width="400"> </div> --- ## Sum of two tracks <div align="center"> <img src="imgs/combineDT2.png" alt="igv" height="400" width="400"> </div> --- ## Create new summed track There are also options for subtract, divide and multiply. <div align="center"> <img src="imgs/combineDT3.png" alt="igv" height="400" width="400"> </div> --- ## IGVtools - [IGVTools](https://software.broadinstitute.org/software/igv/igvtools) can be used to post-process genomics data. - Includes indexing, sorting and genome graph creation. .pull-left[ <img src="imgs/itools.png" alt="igv" height="400" width="400"> ] .pull-right[ <img src="imgs/itools2.png" alt="igv" height="200" width="400"> ] --- ## Saving images of tracks - "File" > "Save Image" - You can easily save images from IGV to vector based svg format. This means you can further customize your tracks and assemble them into figures using [Inkscape](https://inkscape.org/) or Illustrator. --- ## Saving your session - If you want to revisit your tracks at a later date, you can save the entire session. - When you restart later on you just have to reopen the session and you will be right back where you were. - "File" > "Save Session" --- ## IGV web .pull-left[ IGV web is a refactoring of much of the functionality of IGV desktop into JavaScript. This means that we can now access an IGV desktop like genome browser in a modern web browser without the need for any downloading or installing of components. It is is still running locally so will consume memory and CPU as you load more data. ] .pull-right[ IGV web is available at [https://igv.org/app/](https://igv.org/app/)  ] --- ## IGV web The web app looks like the desktop version in your web browser but has some of the functionality stripped away (i.e.. preferences are limited, no group autoscale). If does however contain everything we need to quickly visualize our genomic data from both local and remote files. 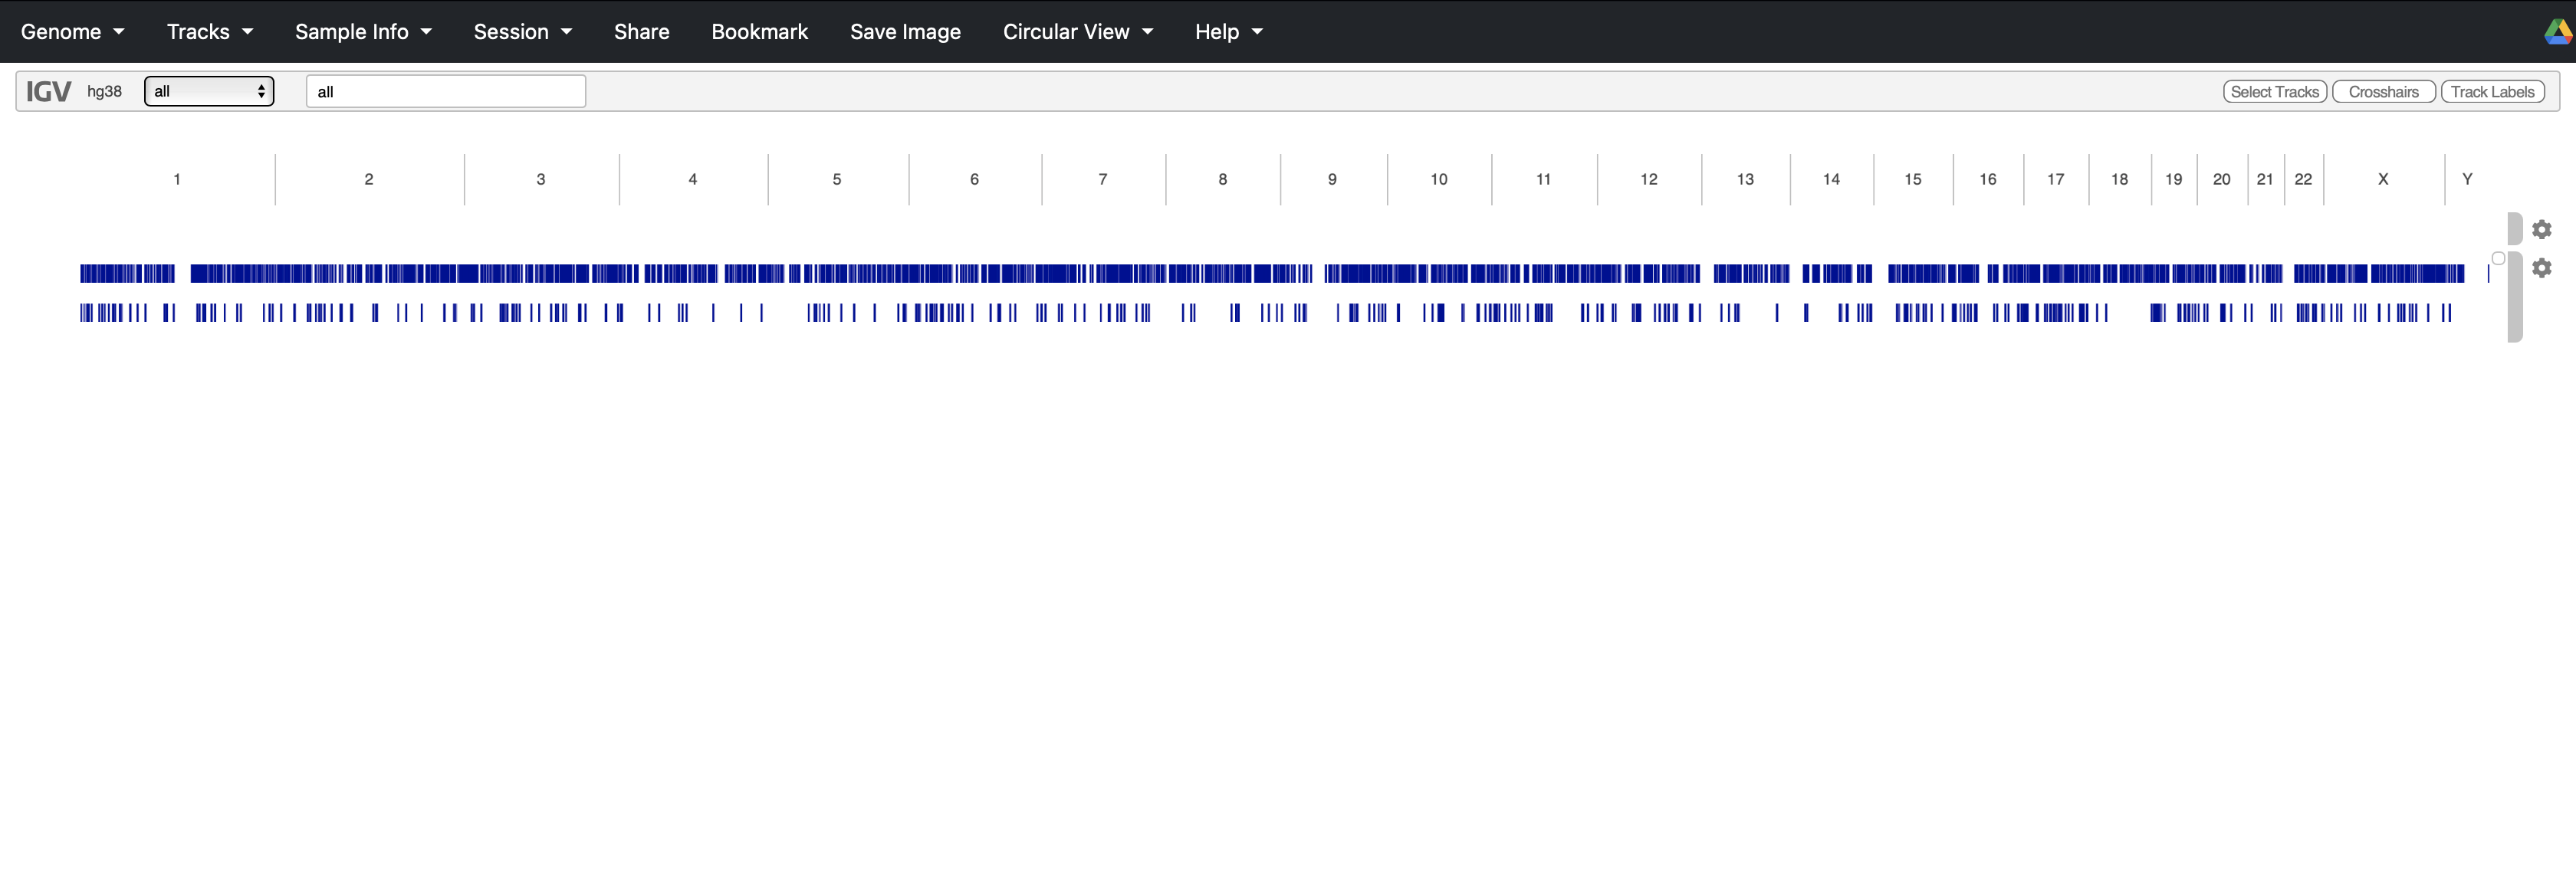 --- ## IGV web We can load genomes from local files, remote files, IGV servers and UCSC genome archive We can also provide Dropbox and Google drive paths but these need to be public and not password controlled. 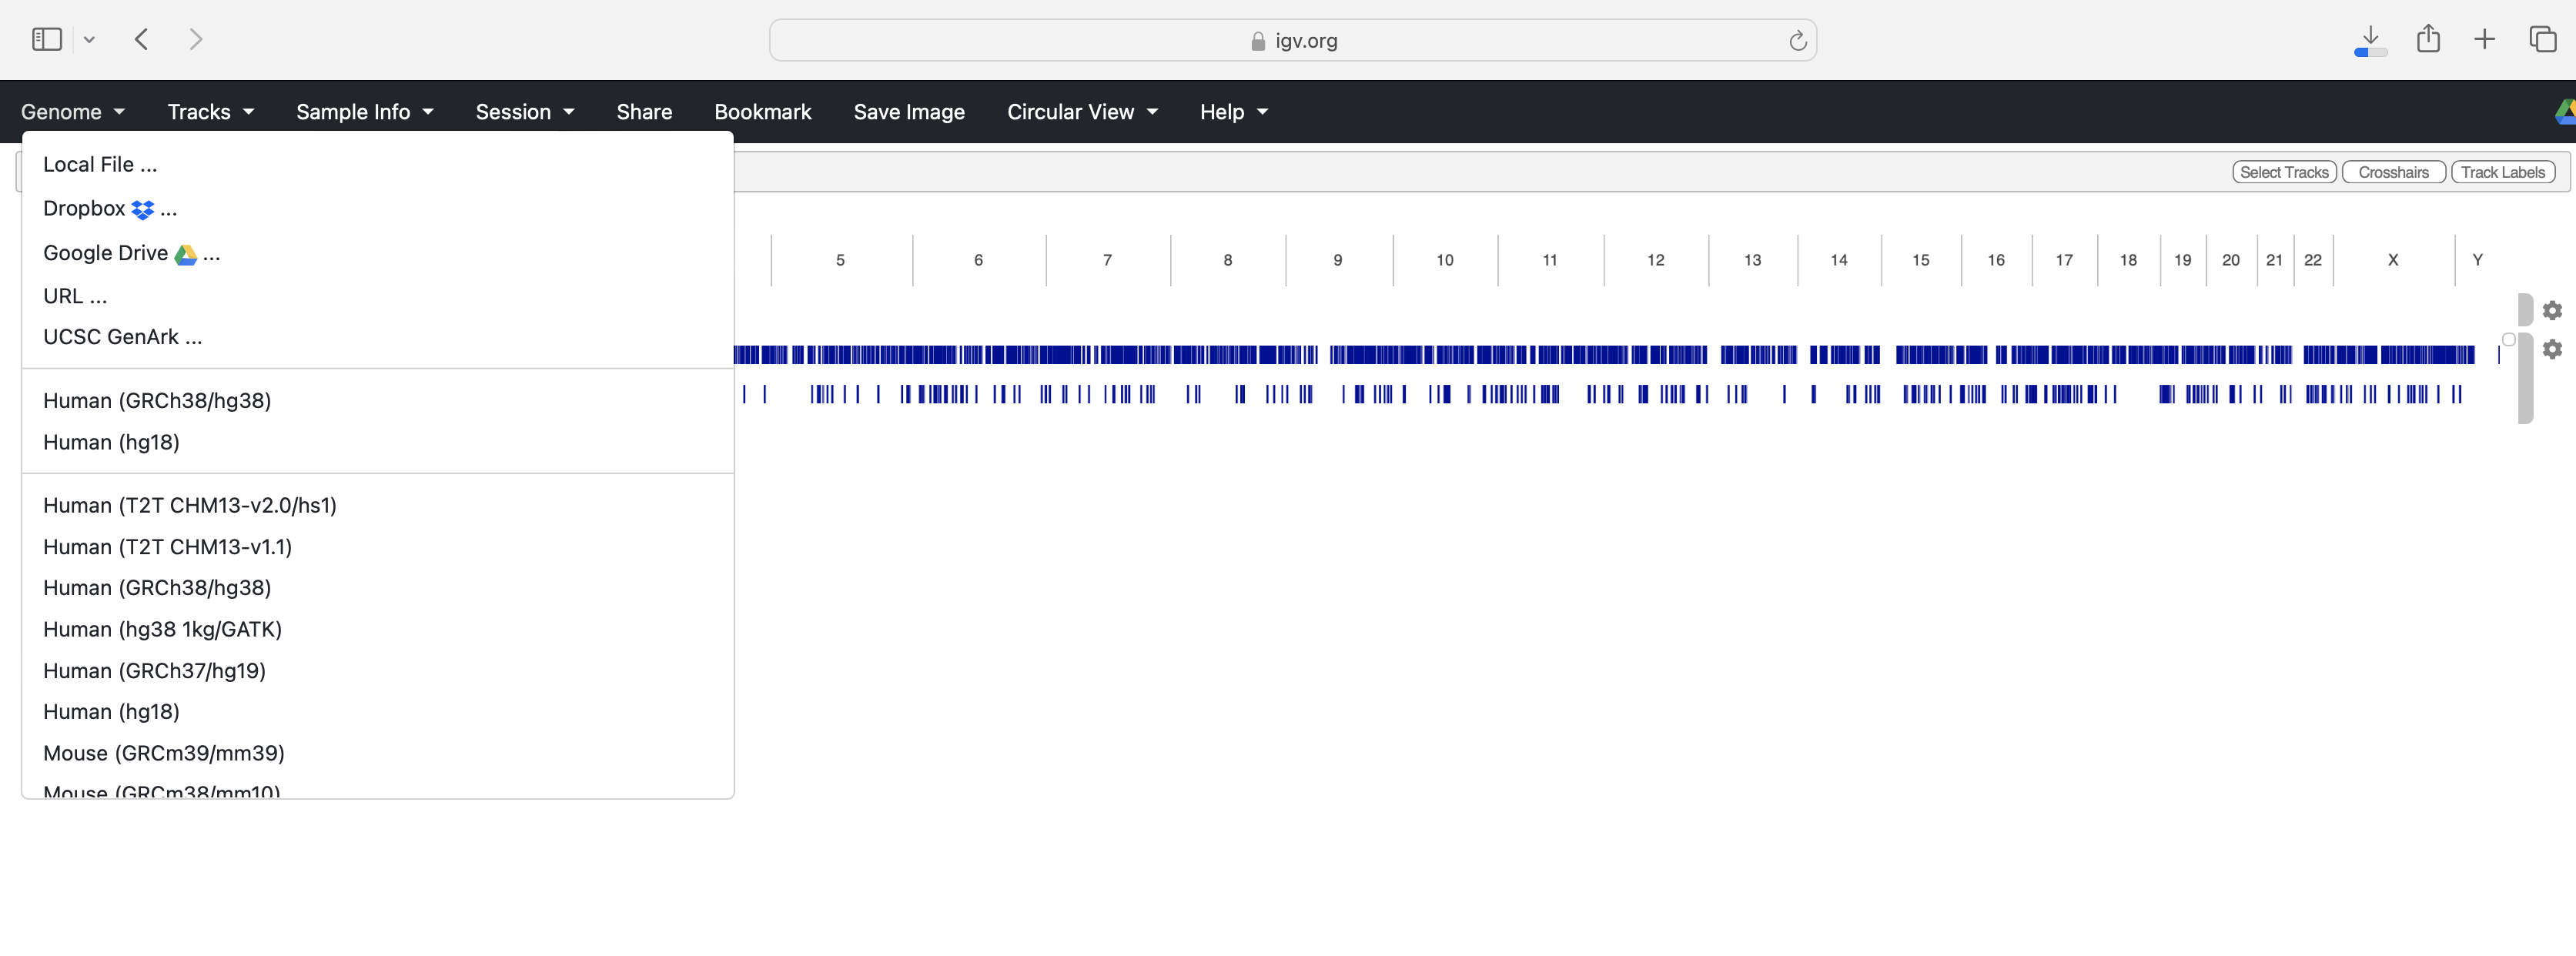 --- ## IGV web Similarly we can load sample data in from local or remote sources and have access to server data (such as Encode) depending on the genome loaded. Additional databases for human hg38 include data from 4D genome project and GTEx eQTLs.  --- ## IGV web With our genome and data loaded we can configure our tracks in many ways we did within the Desktop browser, although not with as many options *yet*.  --- ## IGV web IGV Web has some nice ways of sharing sessions which weren't available to us in IGV desktop. Here we can share a URL to collaborators who can then review the data as we have setup. Note nothing we have loaded from a local file will be able to be captured by this method.  --- ## IGV web We can even share a QR code with people on our posters/t-shirts of our favorite IGV sessions  --- ## IGV web A final neat features of sharing sessions is the ability to create iframes which can be embedded in our HTML reports to show/highlight our IGV sessions of choice 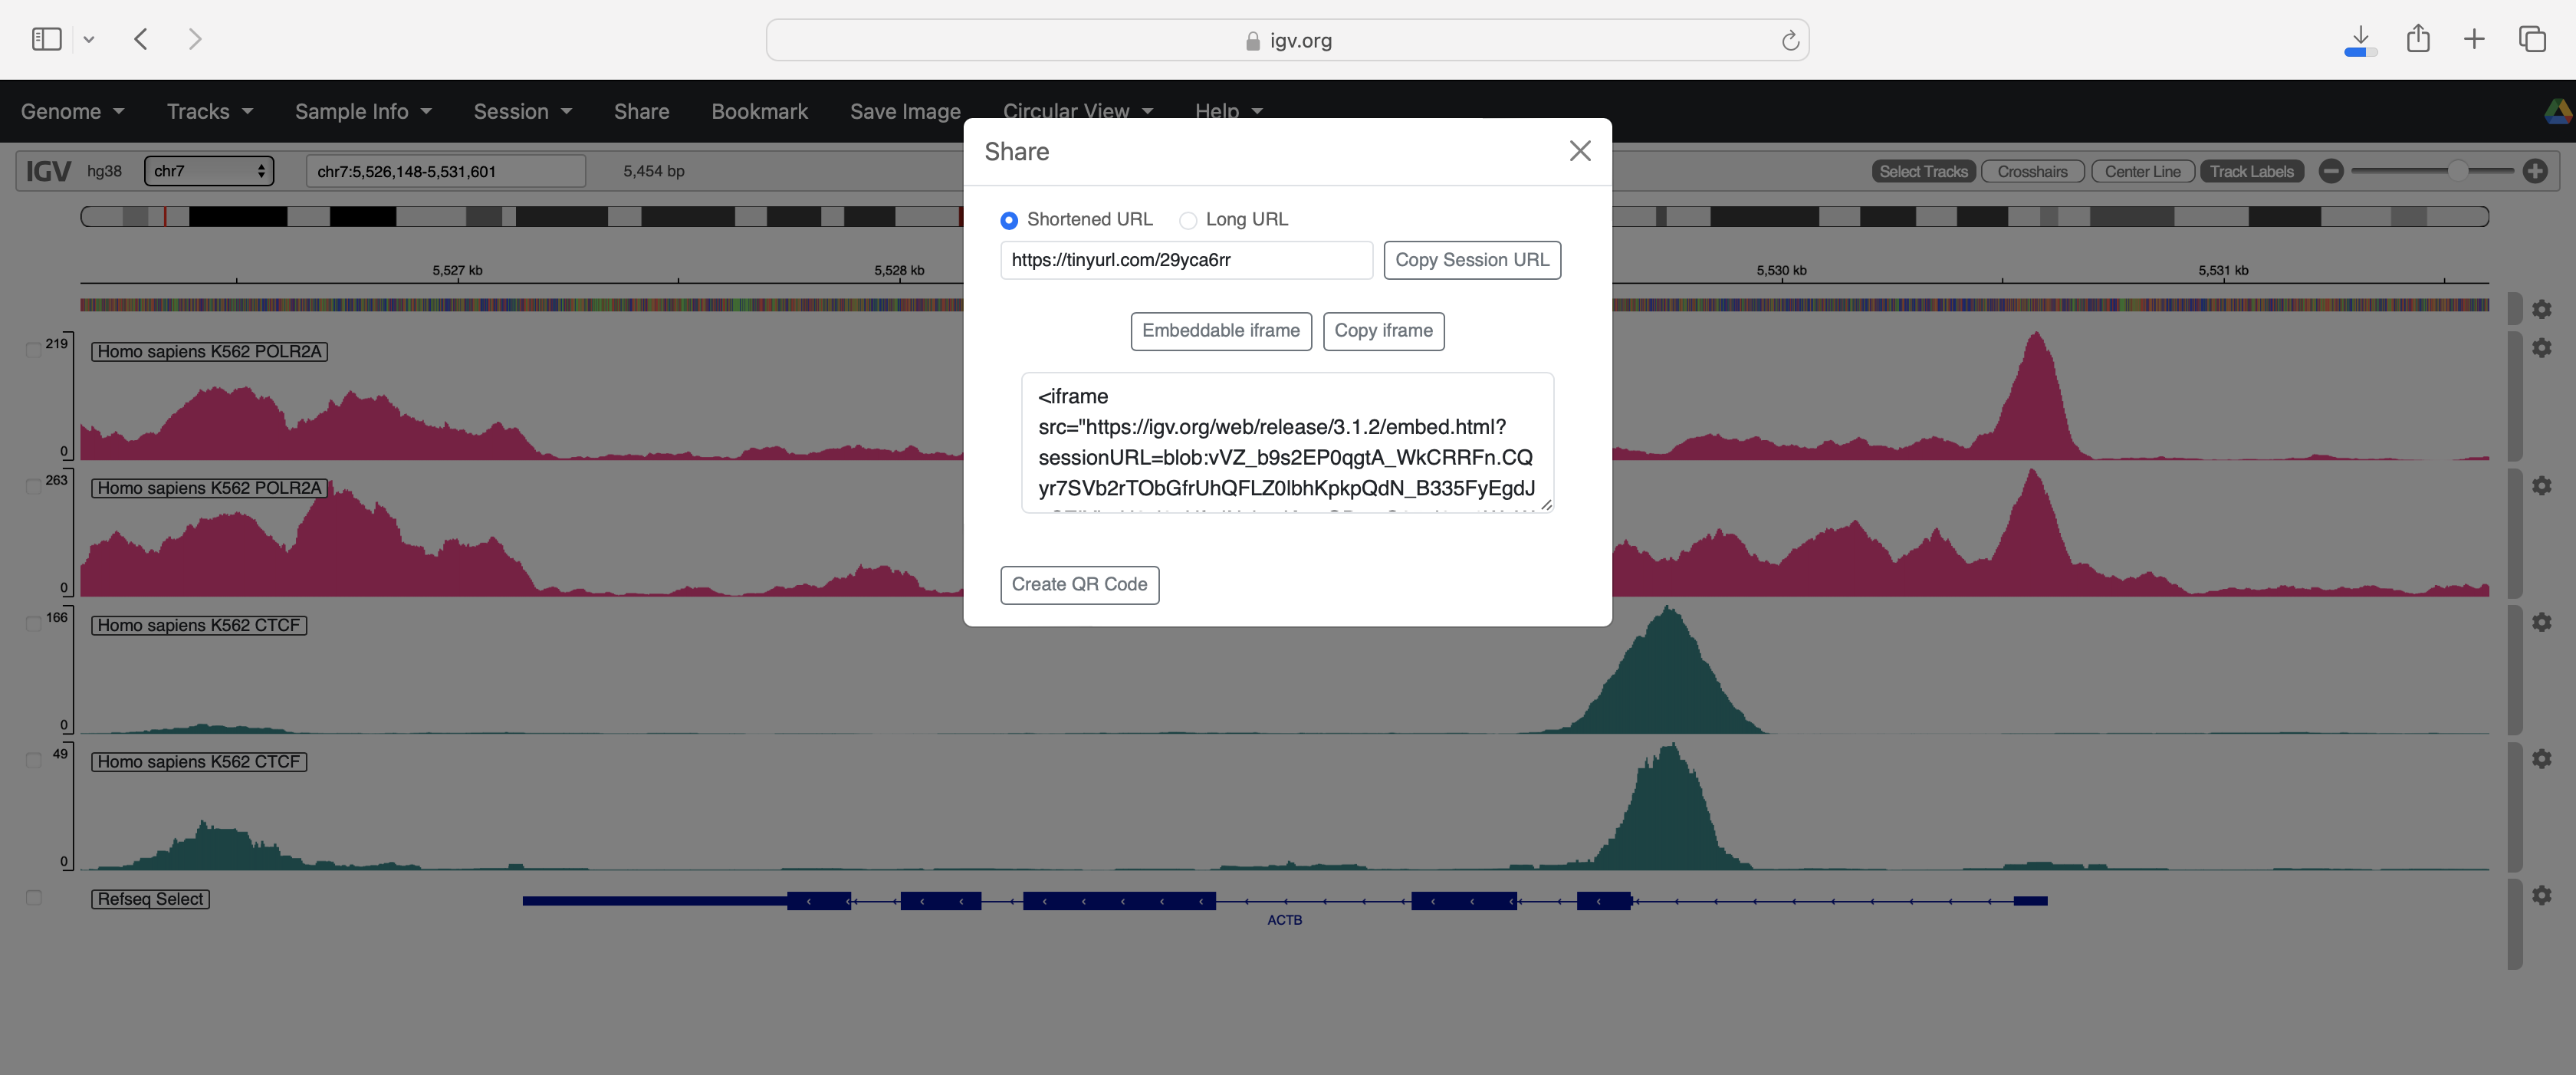 --- ## IGV web We can easily integrate these iframes into our R reports for instance using Rmarkdown and adding a simple tag (*data-external="1"*) to the end of the iframe. .pull-left[ 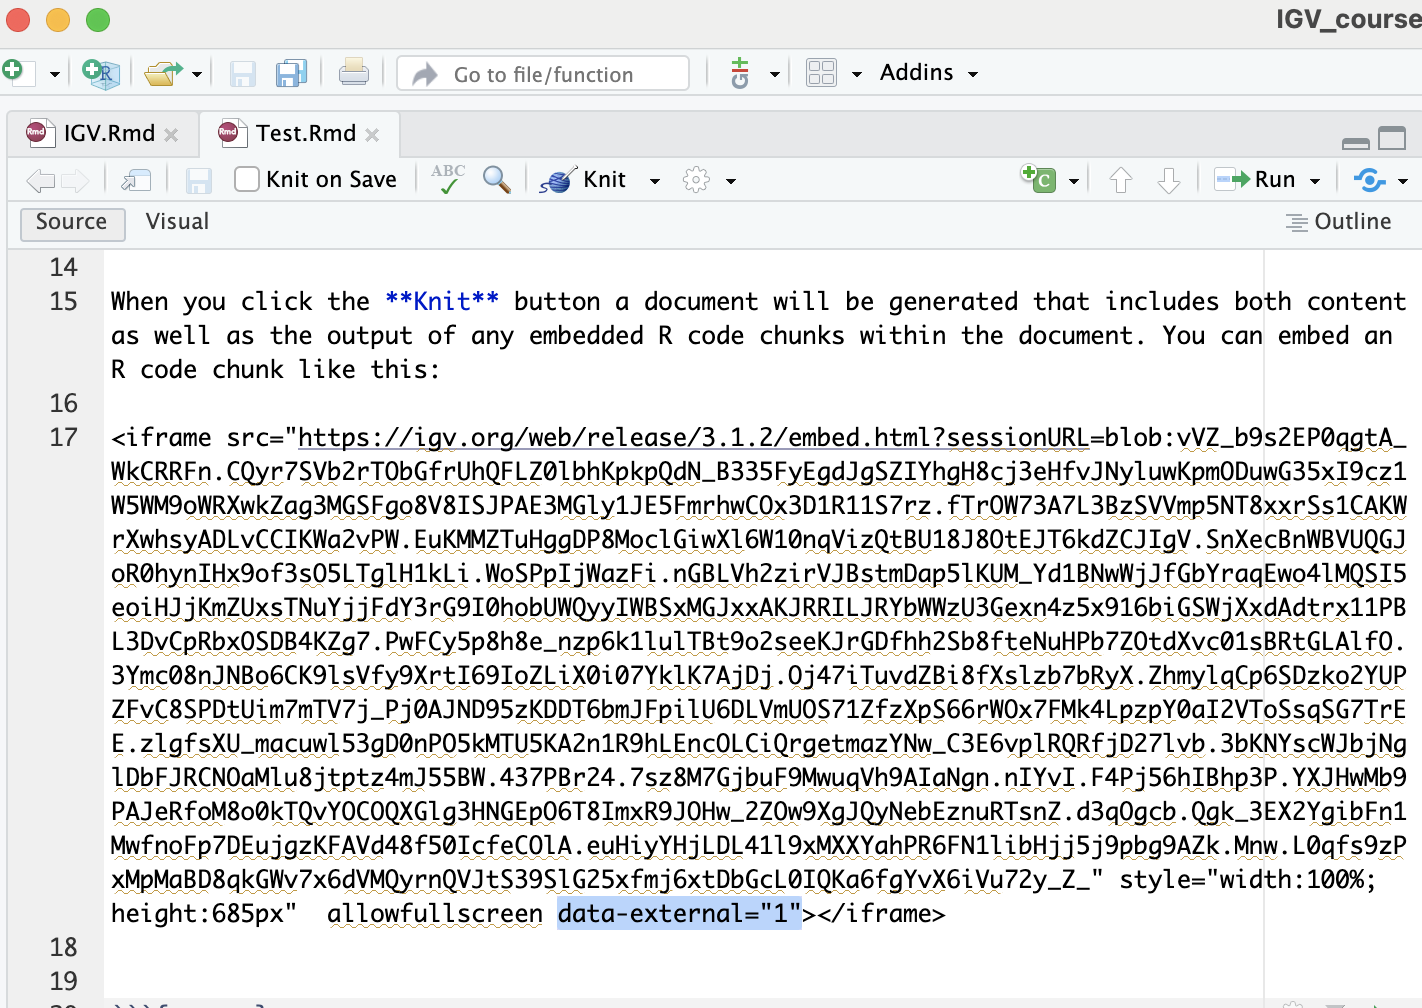 ] .pull-right[ 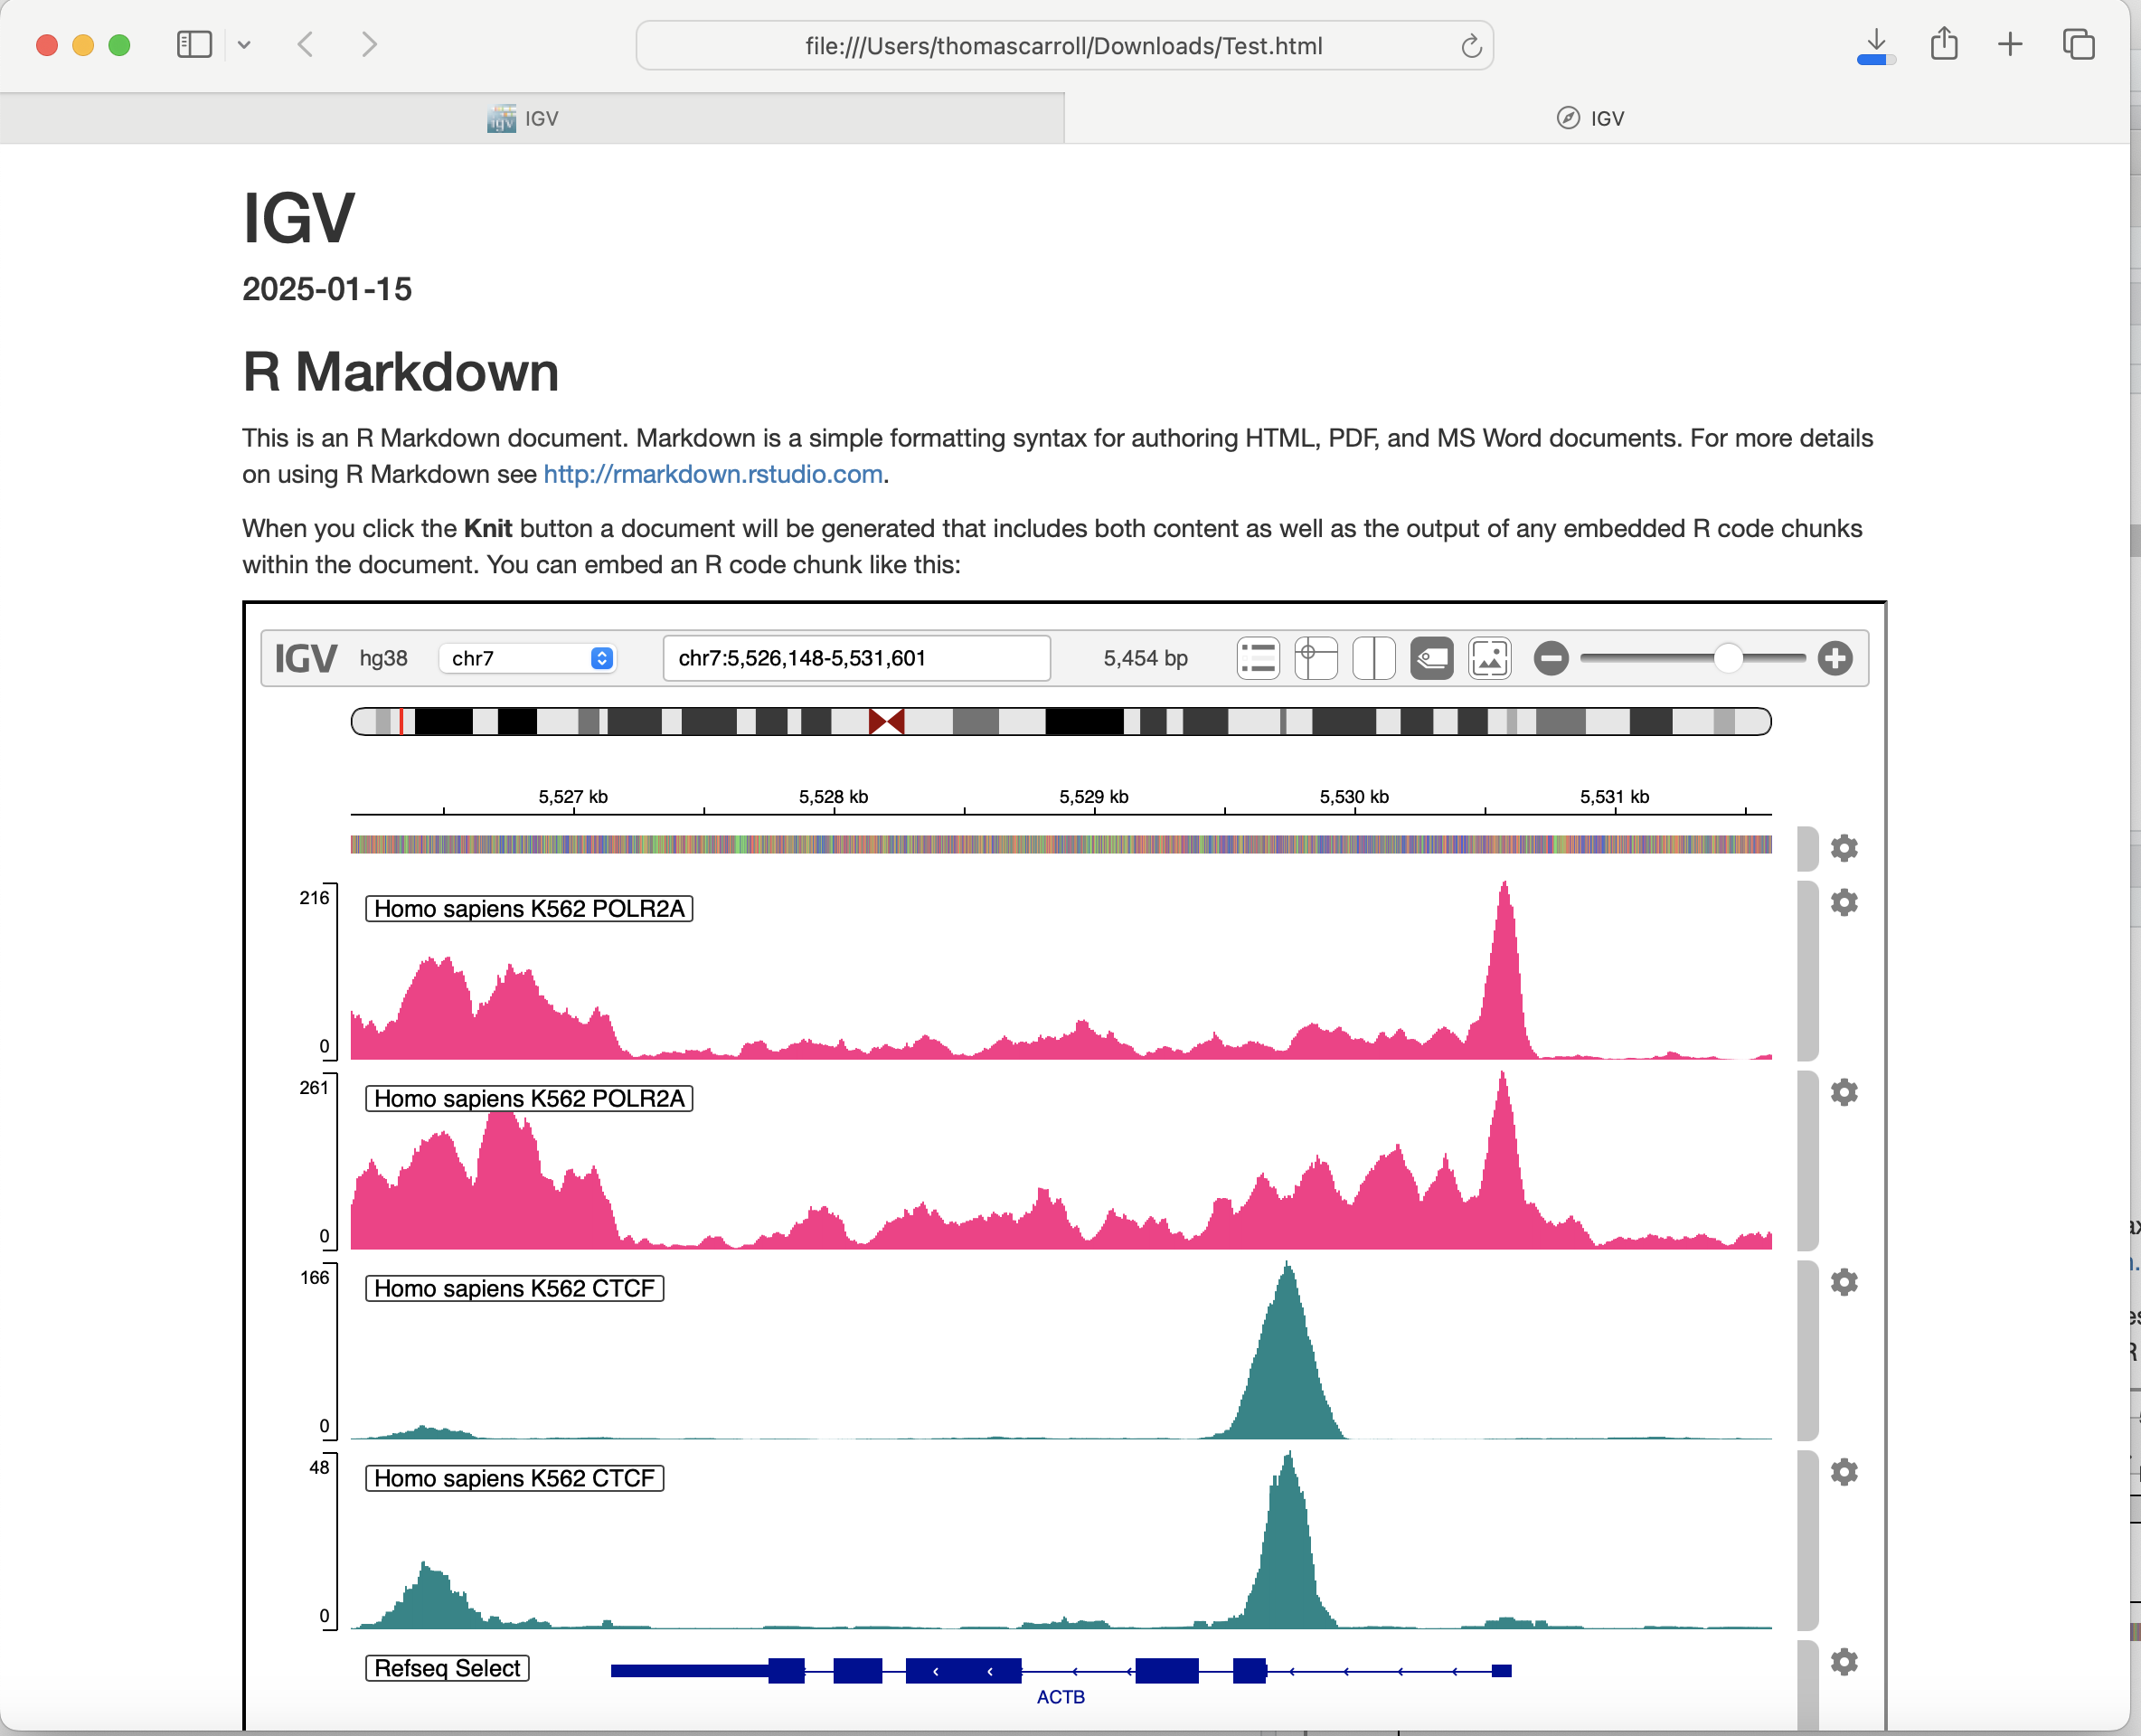 ] --- ## Where to get help? - https://igv.org/doc/desktop/#UserGuide - https://igv.org/doc/desktop/#GettingHelp/ - https://groups.google.com/forum/#!forum/igv-help