Bioinformatics Resource Center
Thomas Carroll
Overview
- Who we are.
- What is our role.
- What are we doing
- Pipelines
- Training
- Analysis Support
Who we are
- BRC formed in July 2017.
- Centralized shared resource for bioinformatics support.
- Currently 1 member (just me).
- 2nd member in December 2017.
- 3rd in early 2018.
- Located in IT pavilion.
- Working with Rockefeller University Hospital Bioinformatics team.
Who we are
(experience)
- NGS and array data analysis.


Who we are
(experience)
- Bioinformatics software development in R/Python/Javascript.


Who we are
(experience)
- Hosting of training courses for bioinformatics data analysis

Role at Rockefeller
- Support bioinformatics analysis from project design through to publication.
- Experimental design
- Development of novel methods.
- Analysis and delivery of data.
Role at Rockefeller

What types of analysis?
- Preprocessing and processing of data.
- Standard downstream analysis.
- Custom analysis.
Analysis with the BRC
- BRC should
- Provide analysis documentation and reproducibility.
- Use best practices.
- Give long term support.
Irreproducibility in Bioinformatics
- Irreproducible results come from multiple sources.
- Copying/coding errors.
- Lack of documentation on versions/software used.

Requirements for reproducibile research
- Journals such as Nature and Cell lead call for more reproducibility in bioinformatics.
- Data submission already a requirement of most peer-reviewed journals (GEO/SRA/ENA).
- Code submission now encouraged in many journals and a requirement of a few.


Workflows for high throughput biology
- Central effort to automate and optimize processing of common data types.
- Reduce copying/coding errors.
- Produce a version controlled, reproducible set of results and data.
- Accelerate initial processing and standard analysis of data.
- With workflow we should -
- Gain better understanding of QC and data. characteristics over time.
- Pool resources for method and software development.
- Easy to compare methods with old results.
Building a workflow for
NGS data analysis
- Automate common NGS data processing and initial analysis.
- Retrieve and process data.
- Perform quality control of data.
- Standard analysis of data.
- Produce deliverable report summarizing useful data metrics and analysis results.
- Scale from small to large datasets.
- Reproducible analysis and version control of both software and genomic data.
Analysis of Next Generation Sequencing
- NGS is commonly used high throughput technique.
- NGS used to study
- Transcriptome/Translatome - RNA-seq and Ribo-seq
- Epigenome - ChIP-seq/exo and ATAC-seq
- Genetic mutation/variation - WGS and Exome-seq.
- Many others.
- RNA-seq, ChIP-seq and ATAC-seq are becoming standard techniques in molecular biology.
The NGSpipeR pipeline
- R package to analyze RNA-seq/ChIP-seq/ATAC-seq data.
- Required genome annotation from Bioconductor packages or user defined.
- Version control through packrat.
- Scalable from laptop to parallelization on HPC cluster.
- Testing through R check/testthat using Travis/Appveyour CI systems.
- Dynamic document reporting.
NGSpipeR analysis workflow

NGSpipeR outputs-
Deliverable, self contained directory structure containing -
- Processed files
- Sequences (fastq).
- Aligned data (BAM).
- Normalized signal graph (bigWigs).
- Counts in genes/transcripts/exons.
- Analysis results
- DE Genes
- DU Transcripts
- GO enrichment
Result files
NGSpipeR outputs-
Reports
- Dynamic document.
- Describes analysis performed.
- Input and output files details.
- QC tables and plots.
- Analysis summaries and visualization.
- Versions used in analysis.
PDF output example

Word/Openoffice example


- rMarkdown readily converted to HTML.
- Allow for construction of a single page or whole websites.
- Can include interactive elements through Javascript.
- Interaction with external tools and websites through HTML and ports.
NGSpipeR outputs-
Interactive Reports
NGSpipeR outputs-
Genome Browsing

Text
- Common step in NGS analysis is to review data in a genome browser.
- IGV (above) offers a desktop system to review.
- Sample Metadata can be included in a required format.
- High degree of configuration possible through XML sessions.
NGSpipeR -
Encode example RNA-seq HTMLoutput

NGSpipeR Homepage

NGSpipeR
- Updates can introduce errors.
- Software used can change defaults or introduce their own errors.
- Testing with CI systems can help identify errors before data processing.
Keeping the workflow running

Custom Analysis
Large component of work is unique analysis or combinations of analysis tailored to the hypothesis under investigation.
- Downstream analysis of data.
- Default analysis offers little insight to particular hypothesis.
Custom Analysis
Some Examples

<-48hrs->
<-48hrs->


<--Development-->
Custom Analysis
- Use rMarkdown to present analysis of R or other languages.
- Capture versions.
- Record code.
- Disseminate methods to user.
Analysis with Dynamic Documents


Custom Analysis
From Unique to Routine
- All methods start as custom analysis.
- Update pipelines to automate the custom when it becomes the common.
- Training in popular downstream methods.
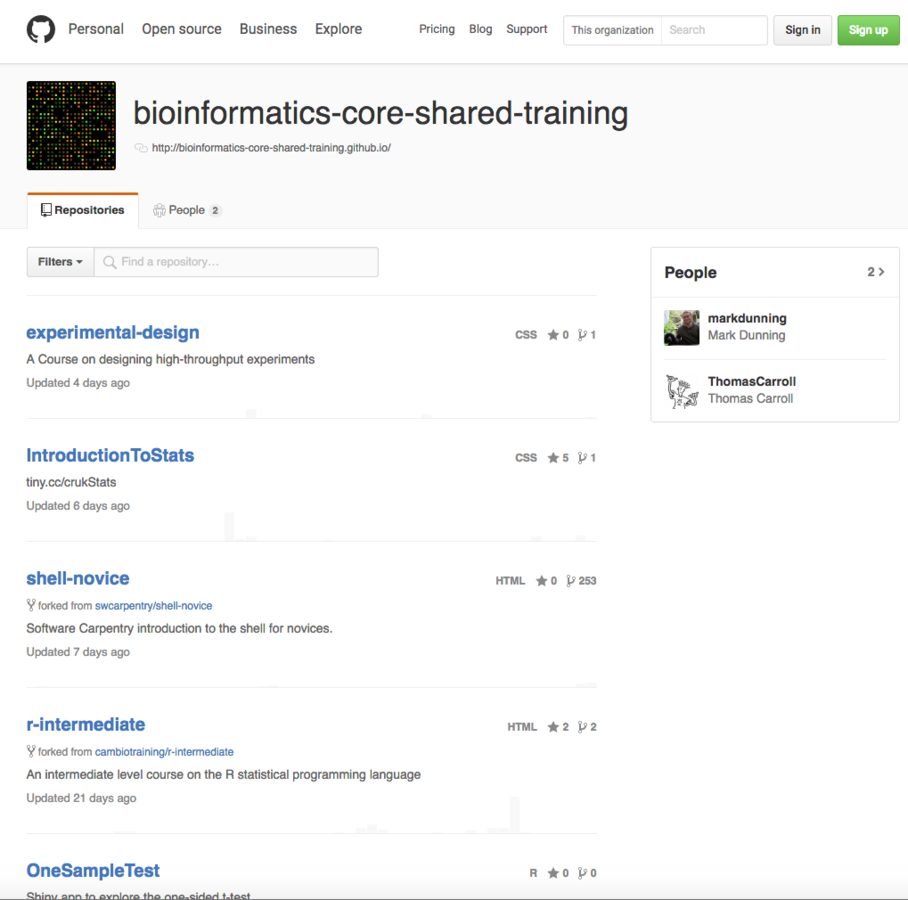
Training
Pipelines
Analysis
Bioinformatics Training
- Different levels of training required.
- Understanding of results or data types.
- Downstream analysis and visualisation techniques.
- Basic programming and in depth analysis techniques.
Structured training program
- Progressive training built from scratch.
- Courses linked by both data and techniques.
- Data reflecting a real world analysis, not toy examples.
Intro to R
Genomic
Files
RNA-seq
Analysis
Alignments


Bioinformatics Training Courses
- Since publications must be reproducible
- Data is available in public repositories
- Methods applied to data is well documented
- Structure bioinformatics courses around published data.
- Retrieve publicly available data.
- Re-create results within publications.
- Expand on results found in publication.
- Learn to evaluate published bioinformatics results.
Training in context
Course Program

Training material
Automation and testing
- Maintaining course material is time consuming
- Software version changes.
- Recompiling of slides, handouts, manual etc.
- Commits to material introduce errors.
- Use similar automation methods to pipeline development
- R "check" evaluates that all code can be run.
- testthat package checks exercises are generating consistent results.
- Github/Travis updates all material on successful completion of above checks/tests.
In class and online
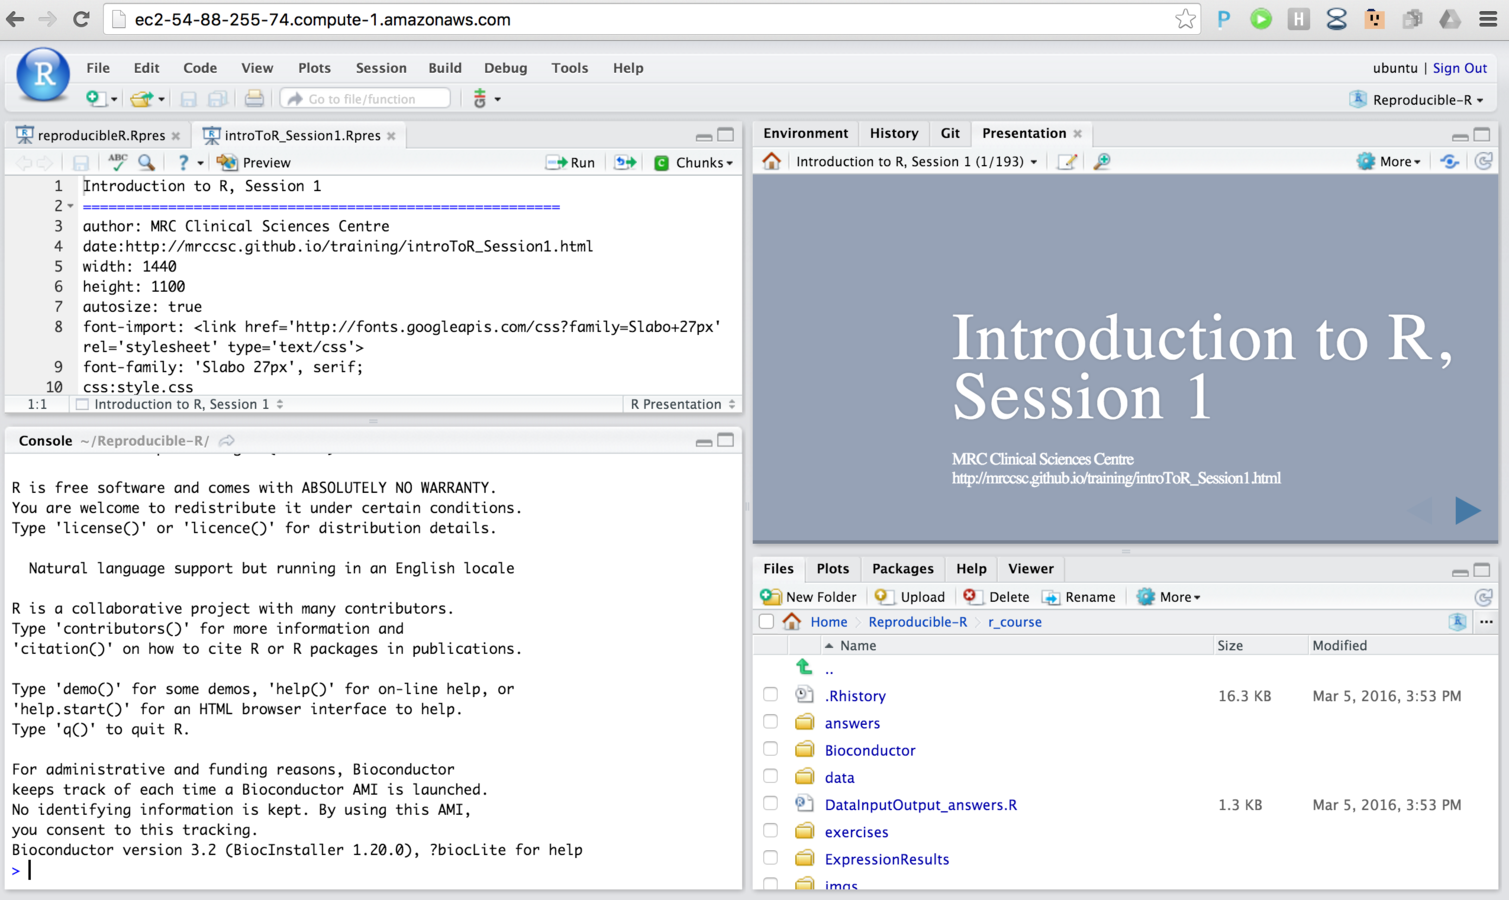
- Teach in a classroom
- Make material available online for reference.
- Create training material from central rMarkdown file.
- Presentation slides.
- PDF handouts.
- Interactive training.


A Rockefeller Bioinformatics Reference Manual

Thanks to
The Rockefeller University
Anthony Carvalloza
Jason Banfelder
Luis Gracia
Cambridge University
Mark Dunning
Shamith Samarajiwa
GlaxoSmithKline
Ziwei Liang
Seven Bridges Genomics
Ines de Santiago