class: center, middle, inverse, title-slide # Integrative Genomics Viewer ### Rockefeller University, Bioinformatics Resource Centre ### <a href="https://rockefelleruniversity.github.io/IGV_course/" class="uri">https://rockefelleruniversity.github.io/IGV_course/</a> --- # IGV --- ## Overview - Introduction to IGV. - What is IGV. - How to run IGV. - Navigating IGV. - The IGV user interface. - Moving around genomes. - Loading and visualising data. - Genome information and annotation. - User supplied data. - Sample information. - External data. - Displaying genomics data - Basic visualisation. - Data dependent visualisation. --- ## What is IGV? - Created by the Broad institute. - Genome browser. - Visualises genomic data (expression, ChIP, resequencing, multiple alignment, shRNA). - Handles most common genomic data types. - Java Desktop application - No dependence on server. - Loads data locally or from URL, consumes memory and CPU. --- ## How to run IGV? - Requires Java - IGV available from Broad <div align="center"> <img src="imgs/broad.png" alt="igv" height="300" width="600"> </div> http://www.broadinstitute.org/software/igv/download --- ## How to run IGV? (Binary) <div align="center"> <img src="imgs/binaryV.png" alt="igv" height="300" width="600"> </div> - Download to computer. - Runs locally. - Archived versions available. --- ## How to run IGV? (Webstart) <div align="center"> <img src="imgs/javaV.png" alt="igv" height="300" width="600"> </div> - Runs from webstart. - Always runs latest version of IGV. --- ## IGV GUI  --- ## IGV GUI .pull-left[  ] .pull-right[ - Sample information panel <1> - Genome Navigation panel <2> - Data panel <3> - Attribute panel <4> ] --- ## Menu bar  - File - Load data/sample information. - Genomes - Load and manage genomes. - View - Display preferences. - Tracks - Group/sort/filter data tracks. - Regions - Create region/gene lists. - Tools - Access to Integrated tools (IGVtools/Bedtools). --- ## Moving around genomes - Cytoband selection and zooming - Scrolling - Selection of region of interest <div align="center"> <img src="imgs/moving.png" alt="igv"> </div> --- ## Moving around genomes 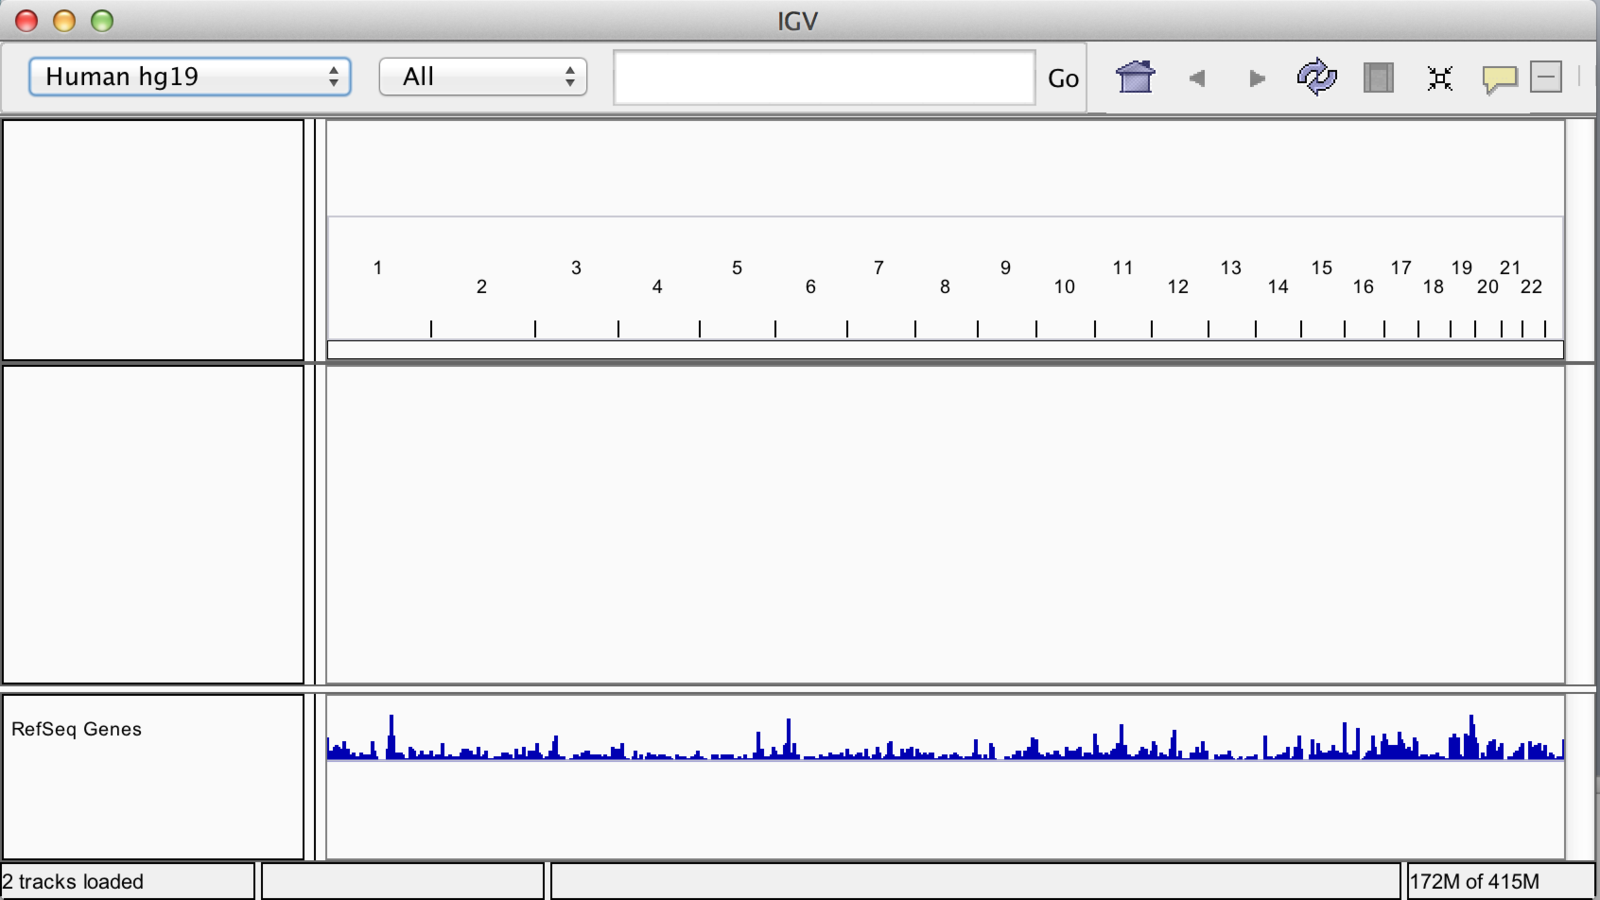 --- ## Zoom .pull-left[ 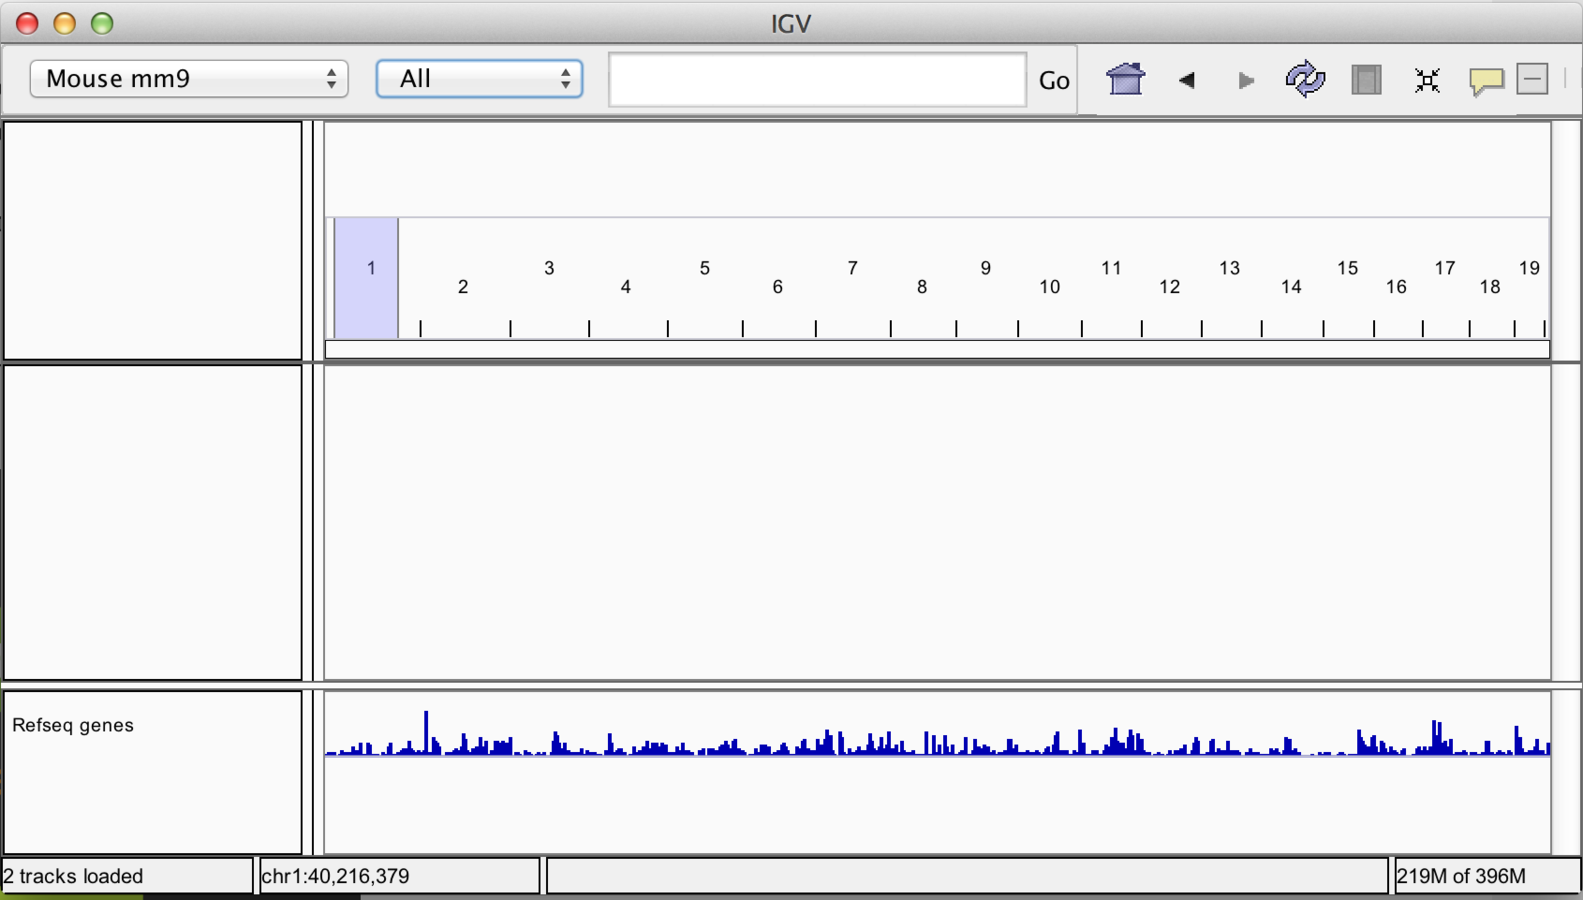 ] .pull-right[ 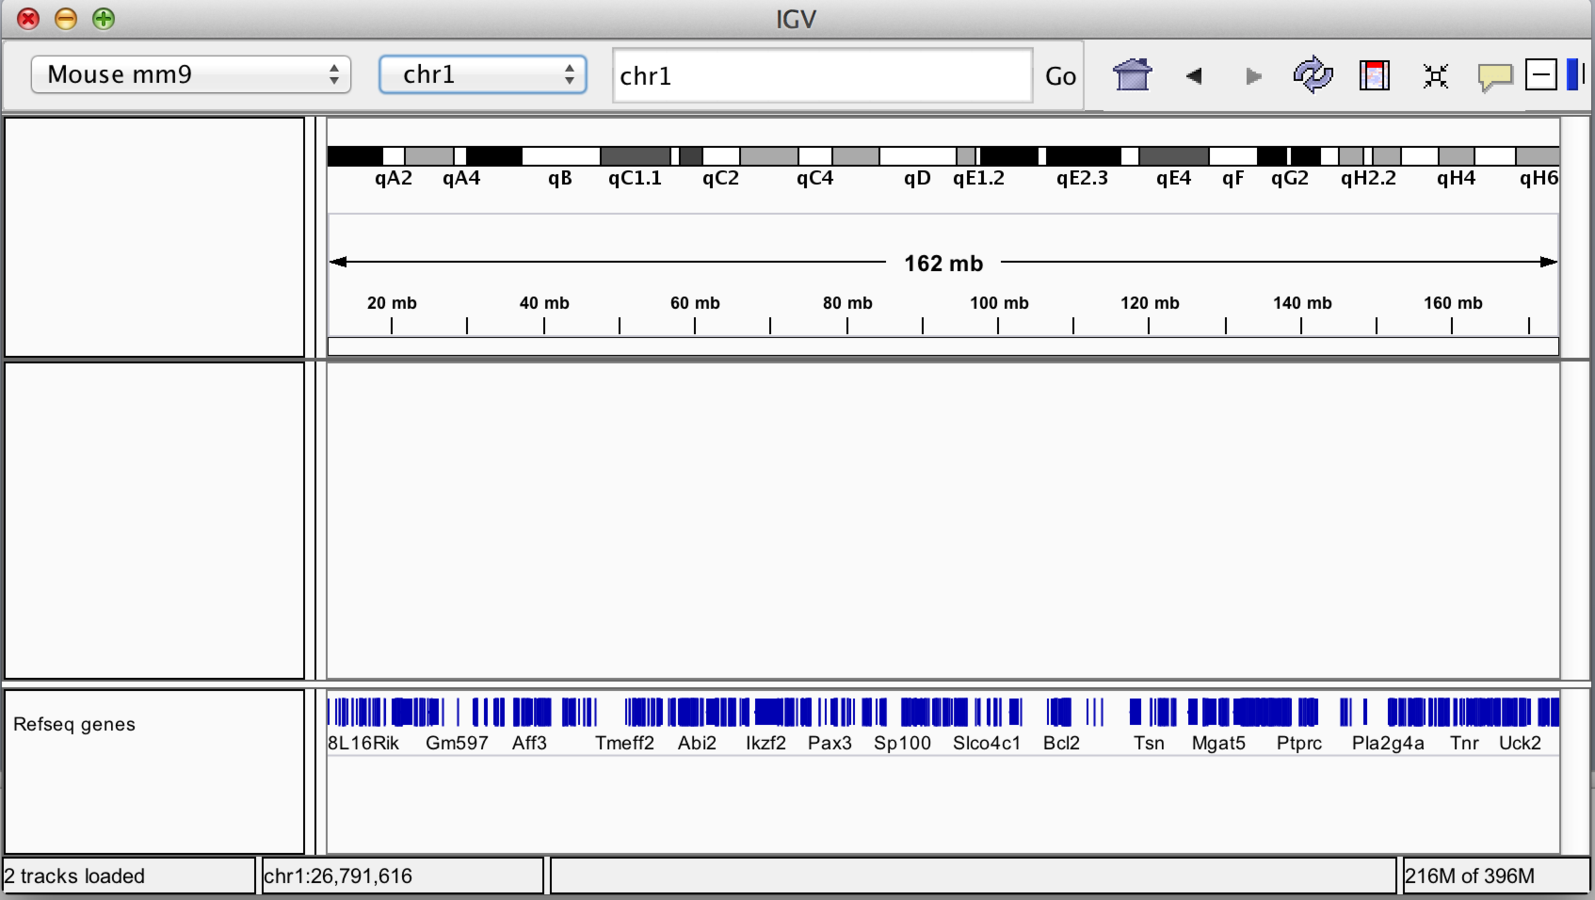 ] --- ## Scrolling 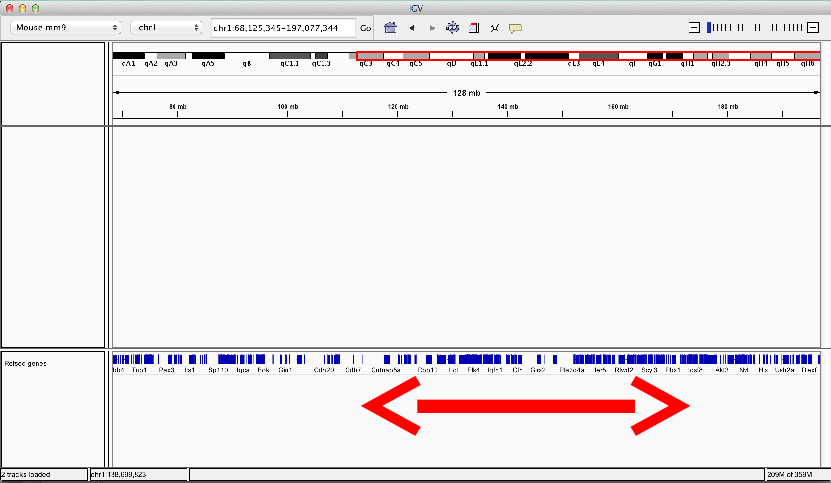 --- ## Jump to region .pull-left[ 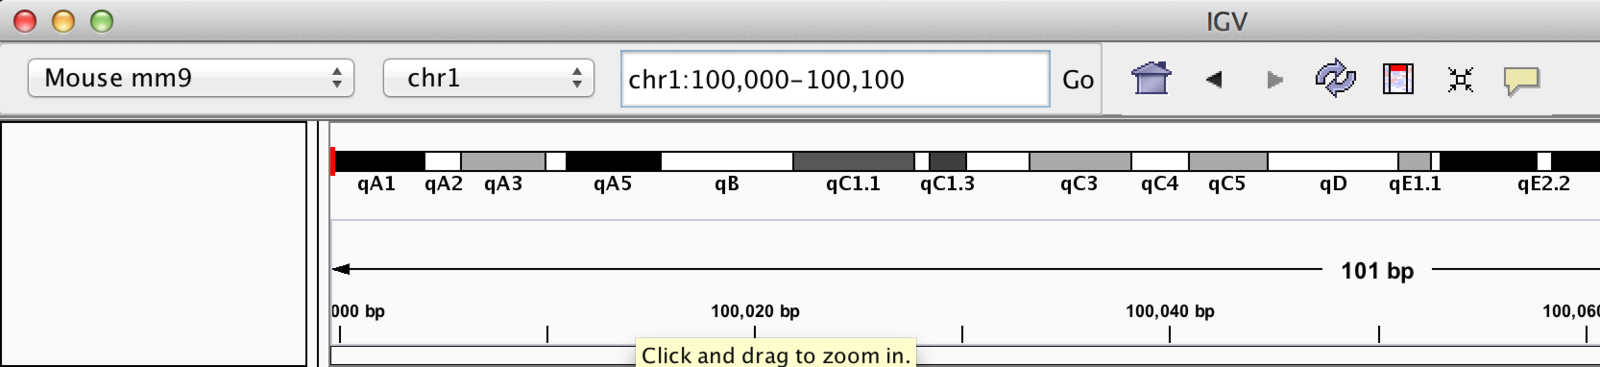 ] .pull-right[ 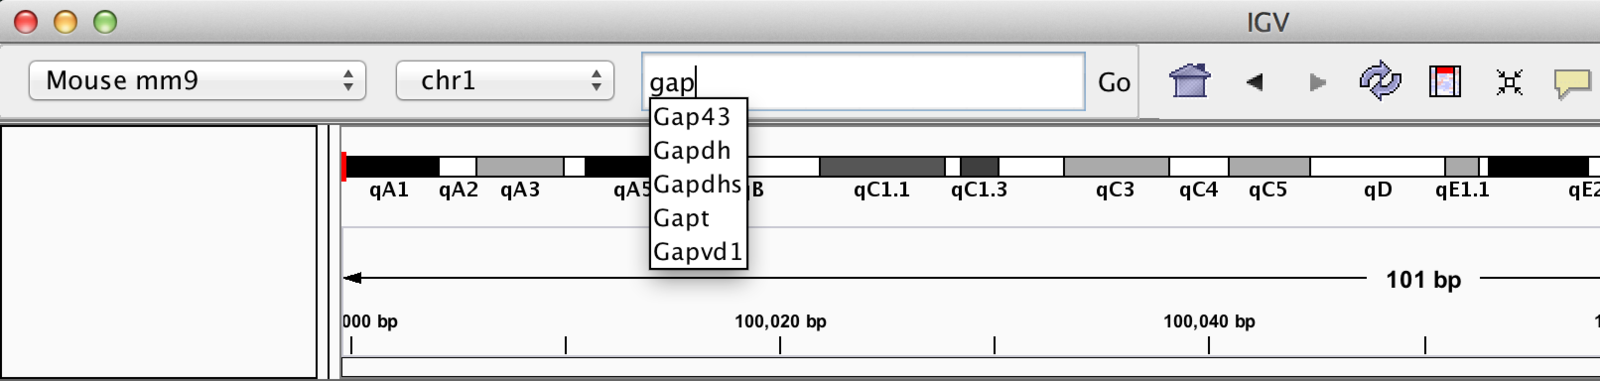 ] --- ## “Bookmarking” regions of interest - Regions may be added to “Regions of interest”. - These act as bookmarks for areas of particular interest. - Bookmarks can be added by: - Bookmarking visible window. - Selecting region within window. --- ## Bookmarking - Visible window .pull-left[ 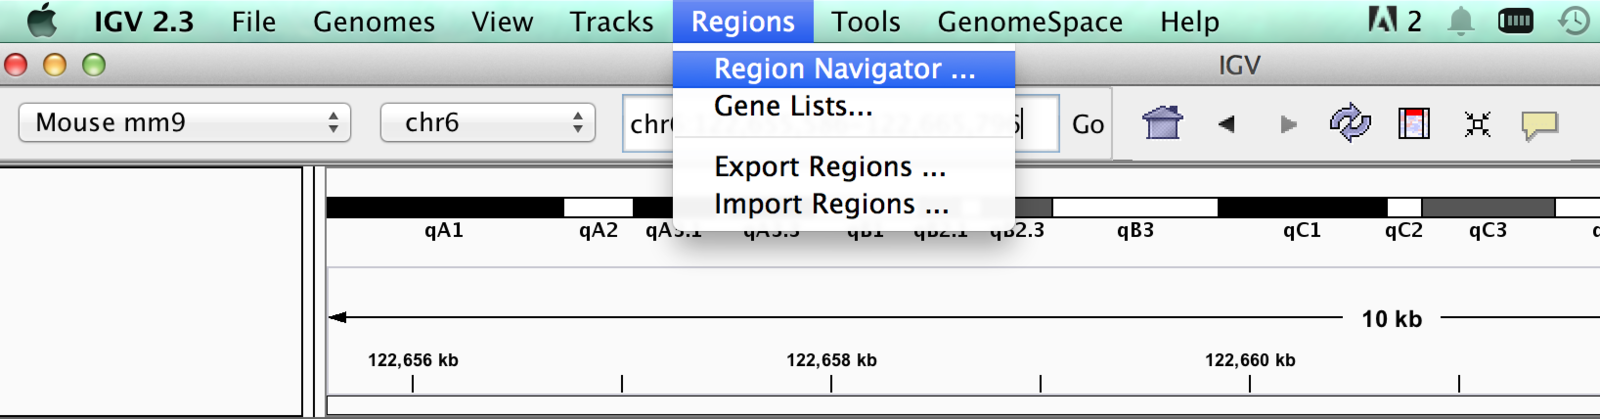 ] .pull-right[ 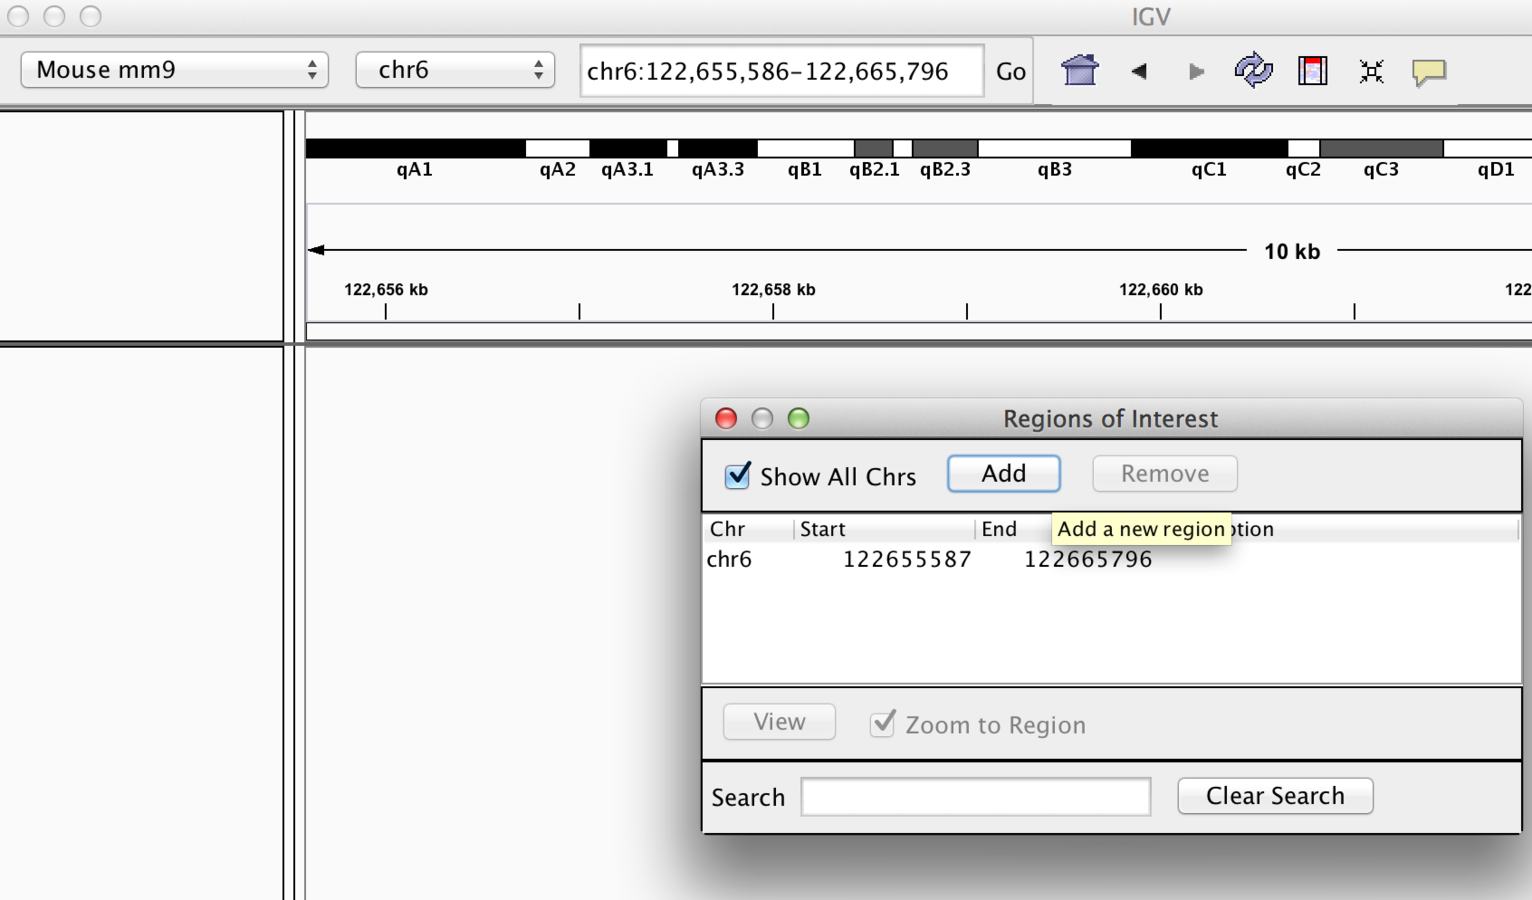 ] --- ## Bookmarking <div align="center"> <img src="imgs/book3.png" alt="igv" height="400" width="600"> </div> --- ## Bookmarking - Bookmarks may be created quickly by selecting "region of interest" button. - Once selected just point-and-click where you want each edge to be. <div align="center"> <img src="imgs/book4.png" alt="igv" height="400" width="600"> </div> --- ## Sequences from regions of interest - A useful feature of "regions of interest" is to retrieve the sequence. - You can even directly BLAT sequences. <div align="center"> <img src="imgs/seq1.png" alt="igv" height="400" width="600"> </div> --- ## Sequences from regions of interest - BLAT results present as table of hits. <div align="center"> <img src="imgs/seq2.png" alt="igv" height="400" width="600"> </div> --- ## Viewing sequences - At a predefined resolution, sequence information becomes available. <div align="center"> <img src="imgs/seq3.png" alt="igv" height="400" width="600"> </div> --- ## Viewing sequences - Strand of sequence can be altered. - Differing translation tables can be selected. <div align="center"> <img src="imgs/seq4.png" alt="igv" height="400" width="600"> </div> --- ## Gene Lists - When you do not have a region of interest but a group of genes you can use Gene Lists ("Regions" > "Gene Lists"). - You create your own list or use one of the curated lists. <div align="center"> <img src="imgs/GL1.png" alt="igv" height="400" width="600"> </div> --- ## Gene Lists Using gene lists you can visualise several genes concurrently. <div align="center"> <img src="imgs/GL2.png" alt="igv" height="400" width="600"> </div> --- class: inverse, center, middle # Loading data in IGV <html><div style='float:left'></div><hr color='#EB811B' size=1px width=720px></html> --- ## Loading Genome Information - Most genomes can be selected from dropdown. .pull-left[  ] .pull-right[  ] --- ## Loading Genome Information .pull-left[ - Genomes not included may be downloaded from repository ] .pull-right[  ] --- ## Loading Genome Information - For supported genomes, gene positions are automatically included in “feature” panel. - Additional gene positions can be loaded into IGV in gff format <div align="center"> <img src="imgs/moving.png" alt="igv" height="400" width="800"> </div> --- ## Loading Sample data - Most common formats can be loaded into IGV through file menu - Acceptable data formats include:- - BED (.bed) - BAM and index (.bam with .bai/.bam.bai) - BigWig (.bw) - BedGraph/Wig (.bedGraph, .wig) - And many more... - For a full list of compatible file formats check out the [IGV website](https://software.broadinstitute.org/software/igv/FileFormats) --- ## Loading Sample Metadata .pull-left[ - IGV allows the inclusion of information on samples. - Sample information is included in sample information panel. ] .pull-right[ 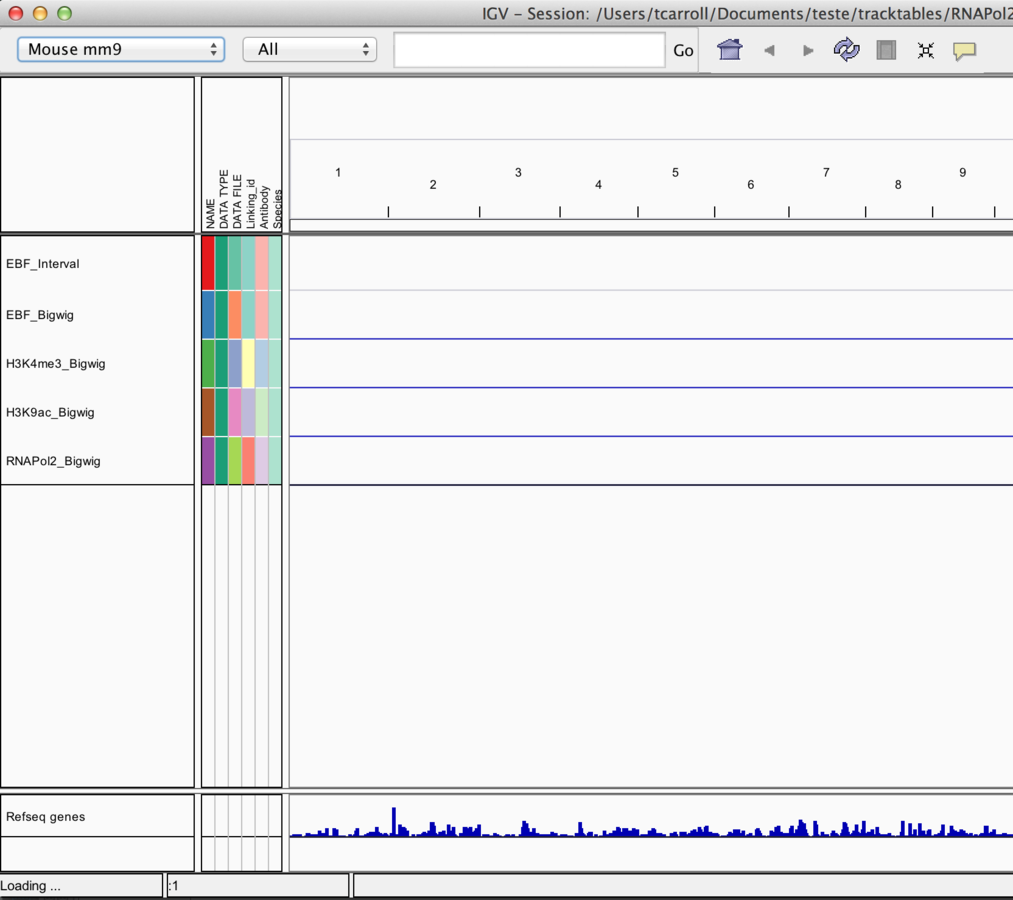 ] --- ## Loading Sample Metadata Example Sample information file http://www.broadinstitute.org/igvdata/exampleFiles/exampleSampleInfo.txt <div align="center"> <img src="imgs/smdT.png" alt="igv" height="400" width="800"> </div> --- ## Sample Metadata with TrackTables - [Tracktables](https://bioconductor.org/packages/release/bioc/html/tracktables.html) is a R/Bioconductor package. - Creates HTML reports with sample information for use with IGV. <div align="center"> <img src="imgs/tracktables.png" alt="igv" height="400" width="500"> </div> --- ## Using sample information - Sample information can include discrete and continuous. - Can be used to “sort” and “filter” tracks. - Can split tracks across panels by “group” --- ## Loading Genome Information .pull-left[ <div align="center"> <img src="imgs/tt1.png" alt="igv" height="150" width="500"> </div> ] .pull-right[ <div align="center"> <img src="imgs/tt2.png" alt="igv" height="400" width="500"> </div> ] --- ## Loading external data and annotation ** Load data from a URL ** - As with UCSC, IGV supports data hosted on external servers. - Data accessible from a URL such as HTTP and FTP can be loaded using "File" > “Load from URL”. --- ## Load data from a URL Try: "https://github.com/ThomasCarroll/tracktables-Data/raw/master/H3K4me3_Example.bw" .pull-top[  ] .pull-bottom[  ] --- ## Loading external data and annotation ** Load data from a server (IGV/Encode servers)** - Unlike UCSC, IGV comes with few external tracks. - External tracks (relevant to the genome) can be loaded from the IGV server or Encode-IGV server. --- ## Load data from a server (IGV/Encode) .pull-left[  ] .pull-right[  ] --- ## Grabbing encode data directly - Encode data can be downloaded from UCSC. - http://genome.ucsc.edu/ENCODE/ - This however does not come with sample information provided through IGV interface. --- class: inverse, center, middle # Viewing Data <html><div style='float:left'></div><hr color='#EB811B' size=1px width=720px></html> --- ## Viewing data - IGV associates common file formats with default display methods. - Most of the time IGV will make a sensible choice how we wish to display data. --- ## Accepted formats and default display. - Information on accepted file formats and default display can be found at: http://www.broadinstitute.org/software/igv/RecommendedFileFormats <img src="imgs/af.png" alt="igv" height="400" width="700"> --- ## Bed/bigBed .pull-left[ - Basic - Tab-delimited - Chrom,Start,End - Bed6 - bigBed (recommended) ] .pull-right[ <img src="imgs/bbed.png" alt="igv" height="400" width="700"> ] --- ## Wig, BedGraph and BigWig .pull-left[ - Wig/bedGraph require high memory load. - Recommended format is bigWig. ] .pull-right[ <img src="imgs/wigBg.png" alt="igv" height="400" width="700"> ] --- ## BAM alignment files .pull-left[ - BAM files contain alignment information. - Require an accompanying .bai index file for display. ] .pull-right[ <img src="imgs/bam1.png" alt="igv" height="400" width="700"> ] --- ## Finer control of display - IGV allows for customization of track display. - "View" > "Preferences" - Select track (right click) --- ## Display preferences ** General ** <div align="center"> <img src="imgs/dpg.png" alt="igv" height="400" width="400"> </div> --- ## Display preferences ** Tracks ** <div align="center"> <img src="imgs/dpt.png" alt="igv" height="400" width="400"> </div> --- ## Display preferences ** Alignments ** <div align="center"> <img src="imgs/dpa.png" alt="igv" height="400" width="400"> </div> --- ## Track display options ** Graph/interval files** - Track colour/appearance <div align="center"> <img src="imgs/tdg.png" alt="igv" height="400" width="400"> </div> --- ## Track display options ** Graph/interval files** - Graph type <div align="center"> <img src="imgs/tdg2.png" alt="igv" height="400" width="400"> </div> --- ## Track display options **Data Scaling** <div align="center"> <img src="imgs/tds.png" alt="igv" height="400" width="400"> </div> --- ## Track display options Autoscaling adjusts to track's visible signal maximum. <div align="center"> <img src="imgs/scaling.png" alt="igv" height="400" width="400"> </div> --- class: inverse, center, middle # Some more useful IGV features <html><div style='float:left'></div><hr color='#EB811B' size=1px width=720px></html> --- ## IGV displays splicing <div align="center"> <img src="imgs/splicing.png" alt="igv" height="400" width="400"> </div> --- ## IGV's Sashimi plots (https://software.broadinstitute.org/software/igv/Sashimi) <div align="center"> <img src="imgs/shashimi.png" alt="igv" height="400" width="400"> </div> --- ## IGV - Overlay tracks <div align="center"> <img src="imgs/overlay.png" alt="igv" height="400" width="400"> </div> --- ## Overlay tracks <div align="center"> <img src="imgs/overlay2.png" alt="igv" height="400" width="400"> </div> --- ## Track summarisation IGV can be used to combine tracks <div align="center"> <img src="imgs/combineDT.png" alt="igv" height="400" width="400"> </div> --- ## Sum of two tracks <div align="center"> <img src="imgs/combineDT2.png" alt="igv" height="400" width="400"> </div> --- ## Create new summed track There are also options for subtract, divide and multiply. <div align="center"> <img src="imgs/combineDT3.png" alt="igv" height="400" width="400"> </div> --- ## IGVtools - [IGVTools](https://software.broadinstitute.org/software/igv/igvtools) can be used to post-process genomics data. - Includes indexing, sorting and genome graph creation. .pull-left[ <img src="imgs/itools.png" alt="igv" height="400" width="400"> ] .pull-right[ <img src="imgs/itools2.png" alt="igv" height="200" width="400"> ] --- ## Saving images of tracks - "File" > "Save Image" - You can easily save images from IGV to vector based svg format. This means you can further customize your tracks and assemble them into figures using [Inkscape](https://inkscape.org/) or Illustrator. --- ## Saving your session - If you want to revisit your tracks at a later date, you can save the entire session. - When you restart later on you just have to reopen the session and you will be right back where you were. - "File" > "Save Session" --- ## Where to get help? - http://www.broadinstitute.org/igv/UserGuide - https://groups.google.com/forum/#!forum/igv-help